29
/
en
AIzaSyAYiBZKx7MnpbEhh9jyipgxe19OcubqV5w
April 1, 2024
245874
South Africa
ZAF
true
2
1
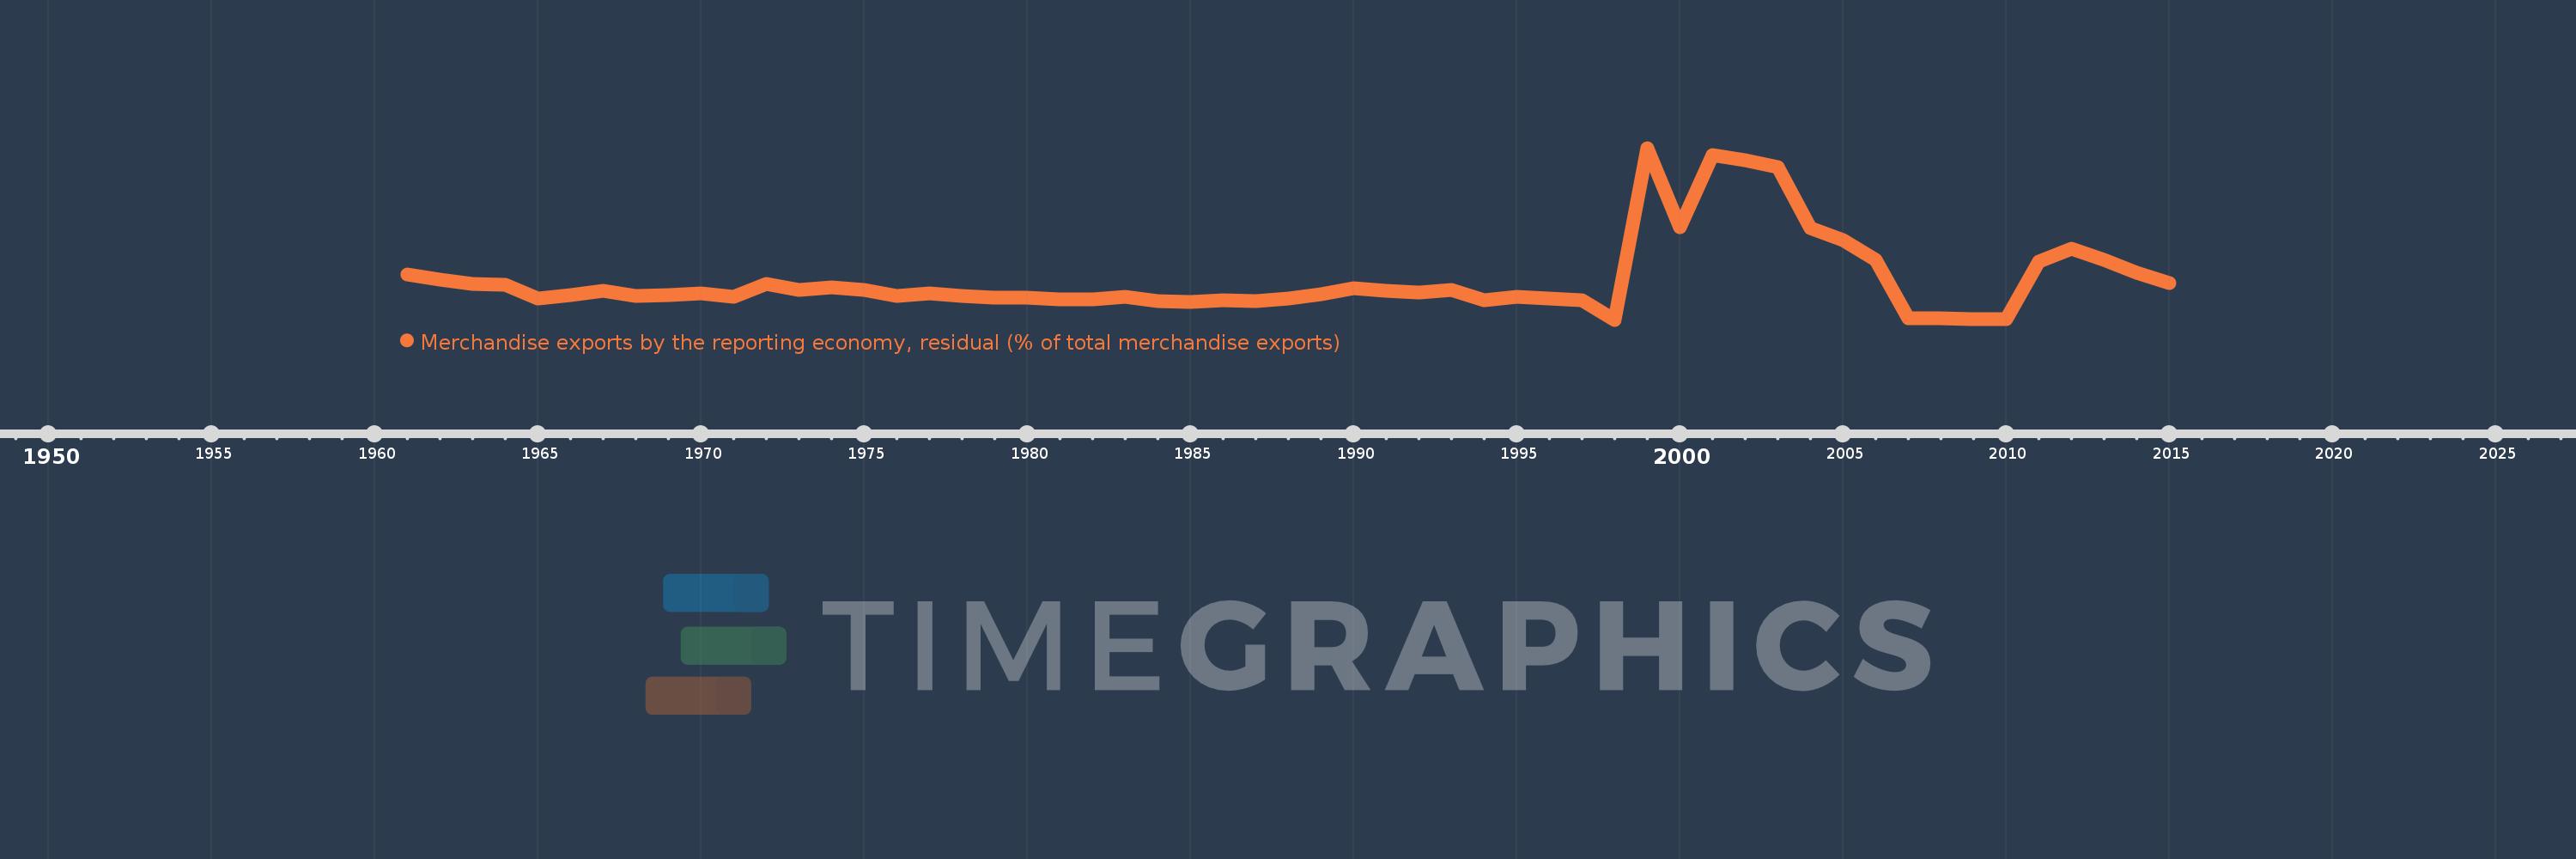
Merchandise exports by the reporting economy, residual (% of total merchandise exports)
2015,2014,2013,2012,2011,2010,2009,2008,2007,2006,2005,2004,2003,2002,2001,2000,1999,1998,1997,1996,1995,1994,1993,1992,1991,1990,1989,1988,1987,1986,1985,1984,1983,1982,1981,1980,1979,1978,1977,1976,1975,1974,1973,1972,1971,1970,1969,1968,1967,1966,1965,1964,1963,1962,1961
This statistics in other country:
AfghanistanAlbaniaAlgeriaAmerican SamoaAngolaAntigua and BarbudaArab WorldArgentinaArmeniaArubaAustraliaAustriaAzerbaijanBahamas, TheBahrainBangladeshBarbadosBelarusBelgiumBelizeBeninBermudaBoliviaBosnia and HerzegovinaBrazilBrunei DarussalamBulgariaBurkina FasoBurundiCabo VerdeCambodiaCameroonCanadaCaribbean small statesCentral African RepublicCentral Europe and the BalticsChadChileChinaColombiaComorosCongo, Dem. Rep.Congo, Rep.Costa RicaCote d'IvoireCroatiaCubaCyprusCzech RepublicDenmarkDjiboutiDominicaDominican RepublicEarly-demographic dividendEast Asia & PacificEast Asia & Pacific (excluding high income)East Asia & Pacific (IDA & IBRD countries)EcuadorEgypt, Arab Rep.El SalvadorEquatorial GuineaEstoniaEthiopiaEuro areaEurope & Central AsiaEurope & Central Asia (excluding high income)Europe & Central Asia (IDA & IBRD countries)European UnionFaroe IslandsFijiFinlandFragile and conflict affected situationsFranceFrench PolynesiaGabonGambia, TheGeorgiaGermanyGhanaGibraltarGreeceGreenlandGrenadaGuamGuatemalaGuineaGuinea-BissauGuyanaHaitiHeavily indebted poor countries (HIPC)High incomeHondurasHong Kong SAR, ChinaHungaryIBRD onlyIcelandIDA & IBRD totalIDA blendIDA onlyIDA totalIndiaIndonesiaIran, Islamic Rep.IraqIrelandIsraelItalyJamaicaJapanJordanKazakhstanKenyaKiribatiKorea, Dem. People’s Rep.Korea, Rep.KosovoKuwaitKyrgyz RepublicLao PDRLate-demographic dividendLatin America & Caribbean Latin America & Caribbean (excluding high income)Latin America & the Caribbean (IDA & IBRD countries)LatviaLeast developed countries: UN classificationLebanonLiberiaLibyaLithuaniaLow & middle incomeLow incomeLower middle incomeLuxembourgMacao SAR, ChinaMacedonia, FYRMadagascarMalawiMalaysiaMaldivesMaliMaltaMauritaniaMauritiusMexicoMiddle East & North AfricaMiddle East & North Africa (excluding high income)Middle East & North Africa (IDA & IBRD countries)Middle incomeMoldovaMongoliaMontenegroMoroccoMozambiqueMyanmarNauruNepalNetherlandsNew CaledoniaNew ZealandNicaraguaNigerNigeriaNorth AmericaNorwayOECD membersOmanOther small statesPacific island small statesPakistanPanamaPapua New GuineaParaguayPeruPhilippinesPolandPortugalPost-demographic dividendPre-demographic dividendQatarRomaniaRussian FederationRwandaSamoaSao Tome and PrincipeSaudi ArabiaSenegalSerbiaSeychellesSierra LeoneSingaporeSlovak RepublicSloveniaSmall statesSolomon IslandsSomaliaSouth AfricaSouth AsiaSouth Asia (IDA & IBRD)SpainSri LankaSt. Kitts and NevisSt. LuciaSt. Vincent and the GrenadinesSub-Saharan Africa Sub-Saharan Africa (excluding high income)Sub-Saharan Africa (IDA & IBRD countries)SudanSurinameSwedenSwitzerlandSyrian Arab RepublicTajikistanTanzaniaThailandTogoTongaTrinidad and TobagoTunisiaTurkeyTurkmenistanTuvaluUgandaUkraineUnited Arab EmiratesUnited KingdomUnited StatesUpper middle incomeUruguayUzbekistanVanuatuVenezuela, RBVietnamWorldYemen, Rep.ZambiaZimbabwe Timeline:
This timeline shows a graph from 1961 to 2015 of South Africa. No data until 1960. Number of actual observations by date: 55.
Source name:
World Development Indicators
Source organization:
World Bank staff estimates based data from International Monetary Fund's Direction of Trade database.
Categories, topics:
Private Sector, Trade
Last updated:
apr 23, 2017
Indicators value changes by year
Minimum:
-0.106
jan 1, 1998
Maximum:
28.208
jan 1, 1999
At the date of observation
Value
Absolute change
Change from previous value
jan 1, 1961
7.397
+7.397
0.0%
jan 1, 1962
6.46
-0.938
-12.68%
jan 1, 1963
5.833
-0.626
-9.7%
jan 1, 1964
5.682
-0.151
-2.59%
jan 1, 1965
3.344
-2.337
-41.14%
jan 1, 1966
3.97
+0.625
18.69%
jan 1, 1967
4.636
+0.666
16.78%
jan 1, 1968
3.83
-0.806
-17.38%
jan 1, 1969
3.943
+0.113
2.95%
jan 1, 1970
4.238
+0.294
7.47%
jan 1, 1971
3.679
-0.559
-13.19%
jan 1, 1972
5.727
+2.049
55.69%
jan 1, 1973
4.736
-0.991
-17.3%
jan 1, 1974
5.22
+0.484
10.22%
jan 1, 1975
4.831
-0.389
-7.46%
jan 1, 1976
3.773
-1.058
-21.89%
jan 1, 1977
4.212
+0.439
11.62%
jan 1, 1978
3.761
-0.451
-10.71%
jan 1, 1979
3.586
-0.175
-4.65%
jan 1, 1980
3.596
+0.01
0.28%
jan 1, 1981
3.314
-0.281
-7.82%
jan 1, 1982
3.22
-0.095
-2.85%
jan 1, 1983
3.607
+0.387
12.03%
jan 1, 1984
2.97
-0.637
-17.67%
jan 1, 1985
2.844
-0.126
-4.23%
jan 1, 1986
3.166
+0.322
11.32%
jan 1, 1987
3.005
-0.161
-5.07%
jan 1, 1988
3.414
+0.408
13.58%
jan 1, 1989
4.124
+0.711
20.82%
jan 1, 1990
5.07
+0.946
22.93%
jan 1, 1991
4.617
-0.452
-8.92%
jan 1, 1992
4.395
-0.223
-4.83%
jan 1, 1993
4.746
+0.352
8.0%
jan 1, 1994
3.103
-1.643
-34.62%
jan 1, 1995
3.654
+0.551
17.74%
jan 1, 1996
3.378
-0.276
-7.56%
jan 1, 1997
3.056
-0.322
-9.52%
jan 1, 1998
-0.106
-3.163
-103.48%
jan 1, 1999
28.208
+28.315
-26.64K%
jan 1, 2000
15.081
-13.127
-46.54%
jan 1, 2001
27.003
+11.922
79.05%
jan 1, 2002
26.253
-0.75
-2.78%
jan 1, 2003
25.051
-1.202
-4.58%
jan 1, 2004
15.038
-10.012
-39.97%
jan 1, 2005
13.018
-2.02
-13.43%
jan 1, 2006
9.761
-3.258
-25.02%
jan 1, 2007
0.082
-9.678
-99.16%
jan 1, 2008
0.096
+0.014
16.69%
jan 1, 2009
0.055
-0.041
-42.37%
jan 1, 2010
0.054
-0.001
-1.99%
jan 1, 2011
9.441
+9.387
17.28K%
jan 1, 2012
11.532
+2.092
22.15%
jan 1, 2013
9.747
-1.785
-15.48%
jan 1, 2014
7.592
-2.155
-22.11%
jan 1, 2015
6.003
-1.589
-20.93%
Ranking of countries by current statistics by years


Comments: