29
/
en
AIzaSyAYiBZKx7MnpbEhh9jyipgxe19OcubqV5w
April 1, 2024
62784
World
WLD
false
2
1
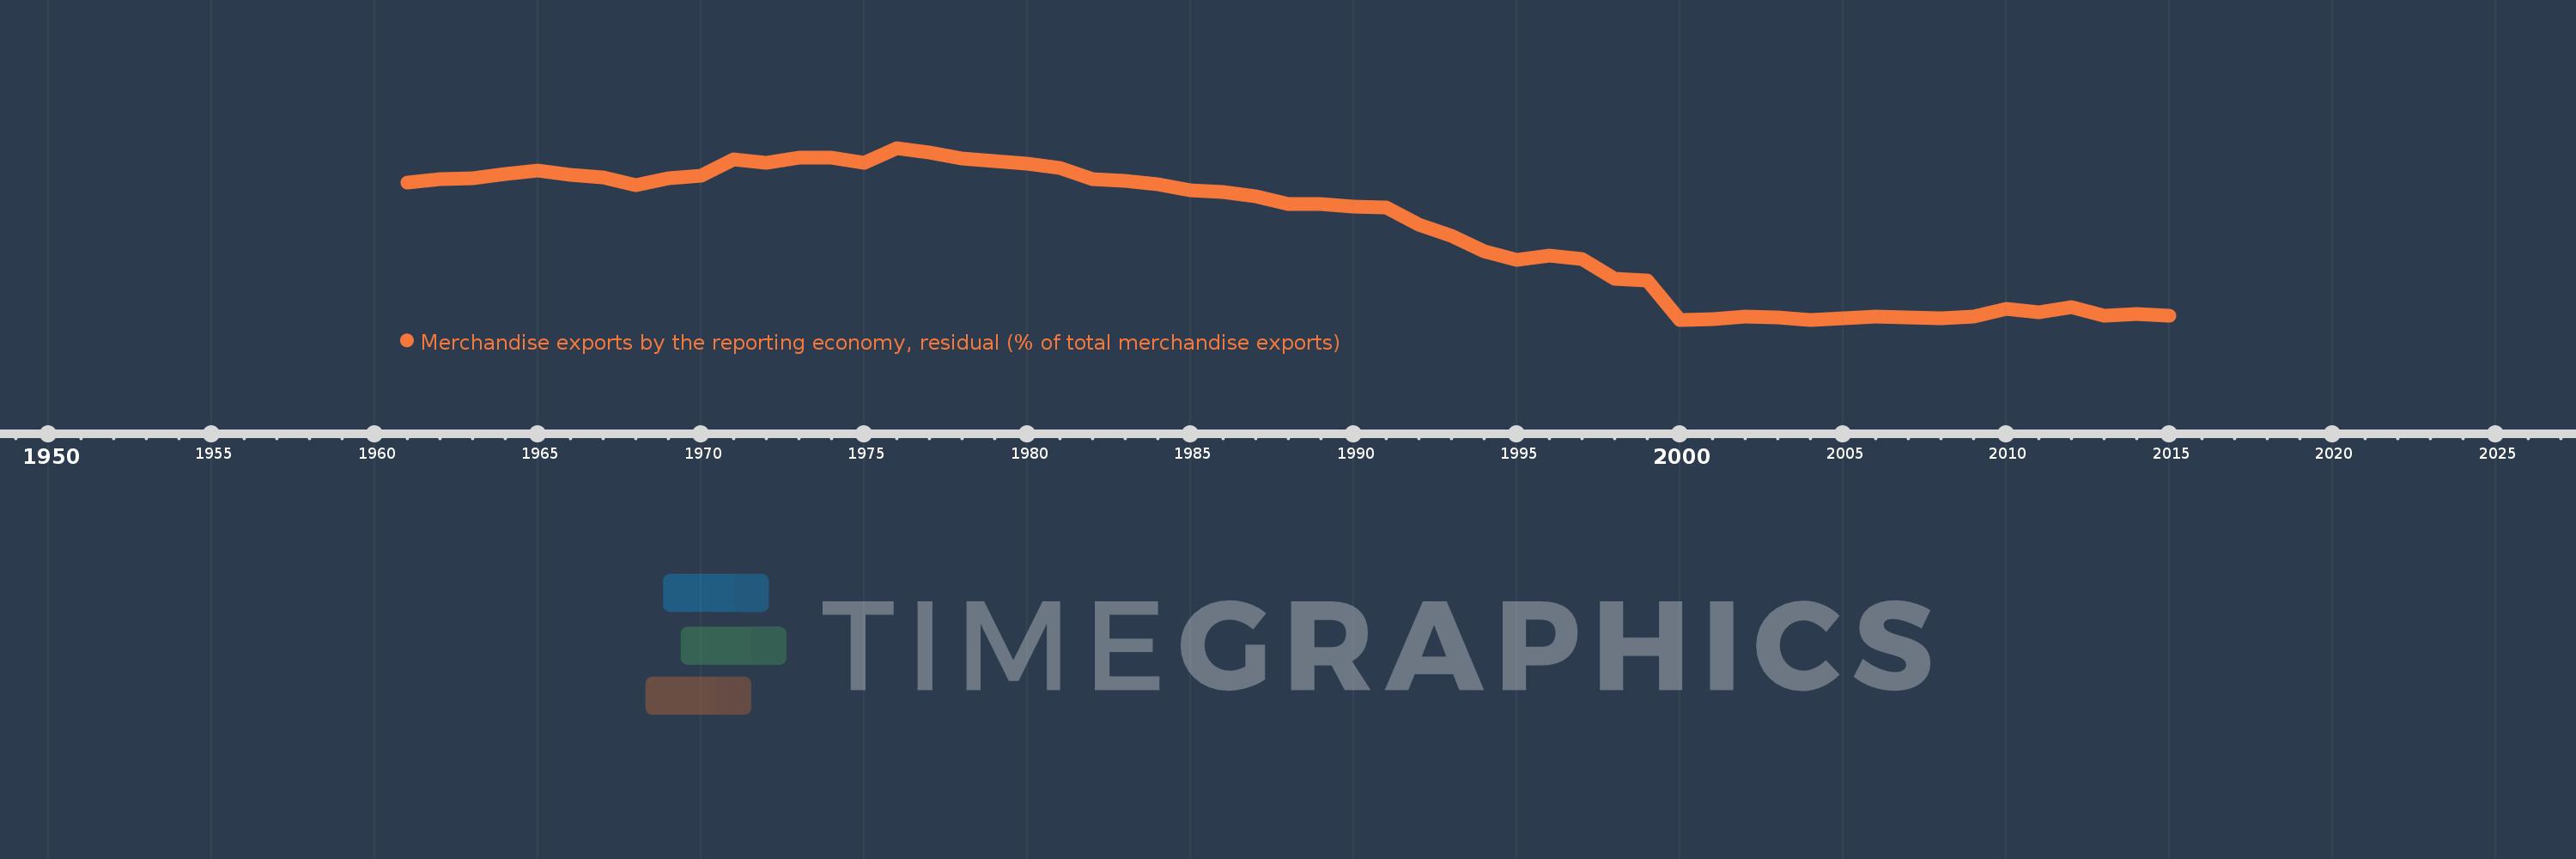
Merchandise exports by the reporting economy, residual (% of total merchandise exports)
2015,2014,2013,2012,2011,2010,2009,2008,2007,2006,2005,2004,2003,2002,2001,2000,1999,1998,1997,1996,1995,1994,1993,1992,1991,1990,1989,1988,1987,1986,1985,1984,1983,1982,1981,1980,1979,1978,1977,1976,1975,1974,1973,1972,1971,1970,1969,1968,1967,1966,1965,1964,1963,1962,1961
This statistics in other country:
AfghanistanAlbaniaAlgeriaAmerican SamoaAngolaAntigua and BarbudaArab WorldArgentinaArmeniaArubaAustraliaAustriaAzerbaijanBahamas, TheBahrainBangladeshBarbadosBelarusBelgiumBelizeBeninBermudaBoliviaBosnia and HerzegovinaBrazilBrunei DarussalamBulgariaBurkina FasoBurundiCabo VerdeCambodiaCameroonCanadaCaribbean small statesCentral African RepublicCentral Europe and the BalticsChadChileChinaColombiaComorosCongo, Dem. Rep.Congo, Rep.Costa RicaCote d'IvoireCroatiaCubaCyprusCzech RepublicDenmarkDjiboutiDominicaDominican RepublicEarly-demographic dividendEast Asia & PacificEast Asia & Pacific (excluding high income)East Asia & Pacific (IDA & IBRD countries)EcuadorEgypt, Arab Rep.El SalvadorEquatorial GuineaEstoniaEthiopiaEuro areaEurope & Central AsiaEurope & Central Asia (excluding high income)Europe & Central Asia (IDA & IBRD countries)European UnionFaroe IslandsFijiFinlandFragile and conflict affected situationsFranceFrench PolynesiaGabonGambia, TheGeorgiaGermanyGhanaGibraltarGreeceGreenlandGrenadaGuamGuatemalaGuineaGuinea-BissauGuyanaHaitiHeavily indebted poor countries (HIPC)High incomeHondurasHong Kong SAR, ChinaHungaryIBRD onlyIcelandIDA & IBRD totalIDA blendIDA onlyIDA totalIndiaIndonesiaIran, Islamic Rep.IraqIrelandIsraelItalyJamaicaJapanJordanKazakhstanKenyaKiribatiKorea, Dem. People’s Rep.Korea, Rep.KosovoKuwaitKyrgyz RepublicLao PDRLate-demographic dividendLatin America & Caribbean Latin America & Caribbean (excluding high income)Latin America & the Caribbean (IDA & IBRD countries)LatviaLeast developed countries: UN classificationLebanonLiberiaLibyaLithuaniaLow & middle incomeLow incomeLower middle incomeLuxembourgMacao SAR, ChinaMacedonia, FYRMadagascarMalawiMalaysiaMaldivesMaliMaltaMauritaniaMauritiusMexicoMiddle East & North AfricaMiddle East & North Africa (excluding high income)Middle East & North Africa (IDA & IBRD countries)Middle incomeMoldovaMongoliaMontenegroMoroccoMozambiqueMyanmarNauruNepalNetherlandsNew CaledoniaNew ZealandNicaraguaNigerNigeriaNorth AmericaNorwayOECD membersOmanOther small statesPacific island small statesPakistanPanamaPapua New GuineaParaguayPeruPhilippinesPolandPortugalPost-demographic dividendPre-demographic dividendQatarRomaniaRussian FederationRwandaSamoaSao Tome and PrincipeSaudi ArabiaSenegalSerbiaSeychellesSierra LeoneSingaporeSlovak RepublicSloveniaSmall statesSolomon IslandsSomaliaSouth AfricaSouth AsiaSouth Asia (IDA & IBRD)SpainSri LankaSt. Kitts and NevisSt. LuciaSt. Vincent and the GrenadinesSub-Saharan Africa Sub-Saharan Africa (excluding high income)Sub-Saharan Africa (IDA & IBRD countries)SudanSurinameSwedenSwitzerlandSyrian Arab RepublicTajikistanTanzaniaThailandTogoTongaTrinidad and TobagoTunisiaTurkeyTurkmenistanTuvaluUgandaUkraineUnited Arab EmiratesUnited KingdomUnited StatesUpper middle incomeUruguayUzbekistanVanuatuVenezuela, RBVietnamWorldYemen, Rep.ZambiaZimbabwe Timeline:
This timeline shows a graph from 1961 to 2015 of World. No data until 1960. Number of actual observations by date: 55.
Source name:
World Development Indicators
Source organization:
World Bank staff estimates based data from International Monetary Fund's Direction of Trade database.
Categories, topics:
Private Sector, Trade
Last updated:
apr 23, 2017
Indicators value changes by year
Maximum:
11.361
jan 1, 1976
At the date of observation
Value
Absolute change
Change from previous value
jan 1, 1961
9.359
+9.359
0.0%
jan 1, 1962
9.54
+0.181
1.93%
jan 1, 1963
9.589
+0.05
0.52%
jan 1, 1964
9.839
+0.249
2.6%
jan 1, 1965
10.038
+0.199
2.03%
jan 1, 1966
9.782
-0.256
-2.55%
jan 1, 1967
9.626
-0.156
-1.6%
jan 1, 1968
9.209
-0.417
-4.33%
jan 1, 1969
9.598
+0.389
4.22%
jan 1, 1970
9.747
+0.149
1.56%
jan 1, 1971
10.694
+0.947
9.72%
jan 1, 1972
10.475
-0.219
-2.05%
jan 1, 1973
10.799
+0.324
3.09%
jan 1, 1974
10.802
+0.003
0.03%
jan 1, 1975
10.47
-0.333
-3.08%
jan 1, 1976
11.361
+0.891
8.51%
jan 1, 1977
11.074
-0.287
-2.53%
jan 1, 1978
10.73
-0.344
-3.1%
jan 1, 1979
10.573
-0.157
-1.46%
jan 1, 1980
10.43
-0.143
-1.35%
jan 1, 1981
10.185
-0.245
-2.35%
jan 1, 1982
9.556
-0.629
-6.18%
jan 1, 1983
9.446
-0.109
-1.14%
jan 1, 1984
9.238
-0.208
-2.21%
jan 1, 1985
8.913
-0.325
-3.52%
jan 1, 1986
8.783
-0.129
-1.45%
jan 1, 1987
8.557
-0.227
-2.58%
jan 1, 1988
8.086
-0.471
-5.5%
jan 1, 1989
8.072
-0.014
-0.18%
jan 1, 1990
7.923
-0.149
-1.84%
jan 1, 1991
7.871
-0.051
-0.65%
jan 1, 1992
6.896
-0.976
-12.39%
jan 1, 1993
6.236
-0.66
-9.58%
jan 1, 1994
5.346
-0.889
-14.27%
jan 1, 1995
4.844
-0.502
-9.4%
jan 1, 1996
5.064
+0.22
4.54%
jan 1, 1997
4.864
-0.2
-3.95%
jan 1, 1998
3.712
-1.151
-23.67%
jan 1, 1999
3.608
-0.105
-2.82%
jan 1, 2000
1.332
-2.276
-63.08%
jan 1, 2001
1.384
+0.052
3.87%
jan 1, 2002
1.518
+0.134
9.7%
jan 1, 2003
1.479
-0.039
-2.59%
jan 1, 2004
1.341
-0.137
-9.29%
jan 1, 2005
1.44
+0.098
7.34%
jan 1, 2006
1.507
+0.067
4.66%
jan 1, 2007
1.457
-0.05
-3.3%
jan 1, 2008
1.441
-0.016
-1.13%
jan 1, 2009
1.529
+0.089
6.15%
jan 1, 2010
1.962
+0.433
28.32%
jan 1, 2011
1.763
-0.199
-10.16%
jan 1, 2012
2.081
+0.318
18.03%
jan 1, 2013
1.575
-0.506
-24.32%
jan 1, 2014
1.653
+0.078
4.97%
jan 1, 2015
1.548
-0.105
-6.37%
Ranking of countries by current statistics by years


Comments: