29
/
en
AIzaSyAYiBZKx7MnpbEhh9jyipgxe19OcubqV5w
April 1, 2024
101329
Canada
CAN
true
2
1
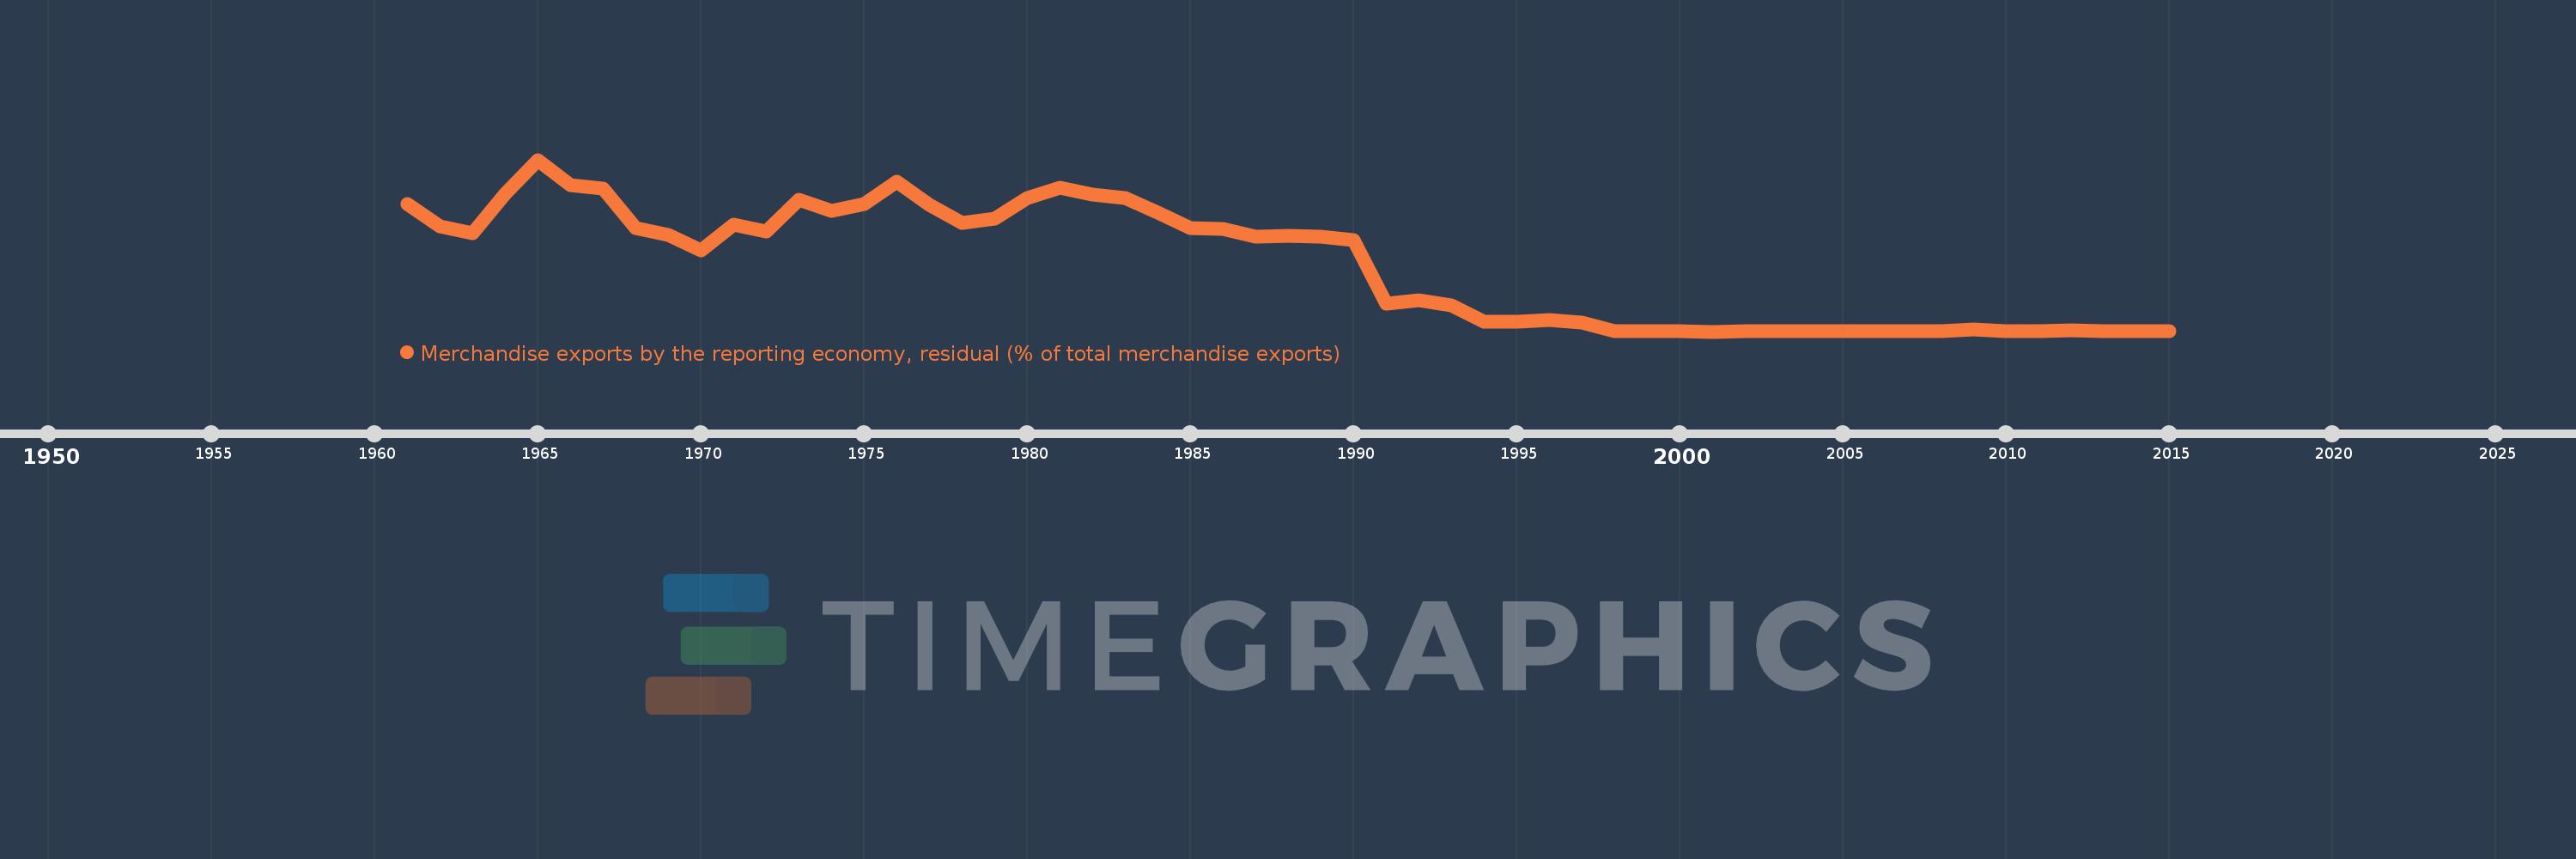
Merchandise exports by the reporting economy, residual (% of total merchandise exports)
2015,2014,2013,2012,2011,2010,2009,2008,2007,2006,2005,2004,2003,2002,2001,2000,1999,1998,1997,1996,1995,1994,1993,1992,1991,1990,1989,1988,1987,1986,1985,1984,1983,1982,1981,1980,1979,1978,1977,1976,1975,1974,1973,1972,1971,1970,1969,1968,1967,1966,1965,1964,1963,1962,1961
This statistics in other country:
AfghanistanAlbaniaAlgeriaAmerican SamoaAngolaAntigua and BarbudaArab WorldArgentinaArmeniaArubaAustraliaAustriaAzerbaijanBahamas, TheBahrainBangladeshBarbadosBelarusBelgiumBelizeBeninBermudaBoliviaBosnia and HerzegovinaBrazilBrunei DarussalamBulgariaBurkina FasoBurundiCabo VerdeCambodiaCameroonCanadaCaribbean small statesCentral African RepublicCentral Europe and the BalticsChadChileChinaColombiaComorosCongo, Dem. Rep.Congo, Rep.Costa RicaCote d'IvoireCroatiaCubaCyprusCzech RepublicDenmarkDjiboutiDominicaDominican RepublicEarly-demographic dividendEast Asia & PacificEast Asia & Pacific (excluding high income)East Asia & Pacific (IDA & IBRD countries)EcuadorEgypt, Arab Rep.El SalvadorEquatorial GuineaEstoniaEthiopiaEuro areaEurope & Central AsiaEurope & Central Asia (excluding high income)Europe & Central Asia (IDA & IBRD countries)European UnionFaroe IslandsFijiFinlandFragile and conflict affected situationsFranceFrench PolynesiaGabonGambia, TheGeorgiaGermanyGhanaGibraltarGreeceGreenlandGrenadaGuamGuatemalaGuineaGuinea-BissauGuyanaHaitiHeavily indebted poor countries (HIPC)High incomeHondurasHong Kong SAR, ChinaHungaryIBRD onlyIcelandIDA & IBRD totalIDA blendIDA onlyIDA totalIndiaIndonesiaIran, Islamic Rep.IraqIrelandIsraelItalyJamaicaJapanJordanKazakhstanKenyaKiribatiKorea, Dem. People’s Rep.Korea, Rep.KosovoKuwaitKyrgyz RepublicLao PDRLate-demographic dividendLatin America & Caribbean Latin America & Caribbean (excluding high income)Latin America & the Caribbean (IDA & IBRD countries)LatviaLeast developed countries: UN classificationLebanonLiberiaLibyaLithuaniaLow & middle incomeLow incomeLower middle incomeLuxembourgMacao SAR, ChinaMacedonia, FYRMadagascarMalawiMalaysiaMaldivesMaliMaltaMauritaniaMauritiusMexicoMiddle East & North AfricaMiddle East & North Africa (excluding high income)Middle East & North Africa (IDA & IBRD countries)Middle incomeMoldovaMongoliaMontenegroMoroccoMozambiqueMyanmarNauruNepalNetherlandsNew CaledoniaNew ZealandNicaraguaNigerNigeriaNorth AmericaNorwayOECD membersOmanOther small statesPacific island small statesPakistanPanamaPapua New GuineaParaguayPeruPhilippinesPolandPortugalPost-demographic dividendPre-demographic dividendQatarRomaniaRussian FederationRwandaSamoaSao Tome and PrincipeSaudi ArabiaSenegalSerbiaSeychellesSierra LeoneSingaporeSlovak RepublicSloveniaSmall statesSolomon IslandsSomaliaSouth AfricaSouth AsiaSouth Asia (IDA & IBRD)SpainSri LankaSt. Kitts and NevisSt. LuciaSt. Vincent and the GrenadinesSub-Saharan Africa Sub-Saharan Africa (excluding high income)Sub-Saharan Africa (IDA & IBRD countries)SudanSurinameSwedenSwitzerlandSyrian Arab RepublicTajikistanTanzaniaThailandTogoTongaTrinidad and TobagoTunisiaTurkeyTurkmenistanTuvaluUgandaUkraineUnited Arab EmiratesUnited KingdomUnited StatesUpper middle incomeUruguayUzbekistanVanuatuVenezuela, RBVietnamWorldYemen, Rep.ZambiaZimbabwe Timeline:
This timeline shows a graph from 1961 to 2015 of Canada. No data until 1960. Number of actual observations by date: 55.
Source name:
World Development Indicators
Source organization:
World Bank staff estimates based data from International Monetary Fund's Direction of Trade database.
Categories, topics:
Private Sector, Trade
Last updated:
apr 23, 2017
Indicators value changes by year
Maximum:
10.187
jan 1, 1965
At the date of observation
Value
Absolute change
Change from previous value
jan 1, 1961
7.579
+7.579
0.0%
jan 1, 1962
6.249
-1.33
-17.54%
jan 1, 1963
5.838
-0.411
-6.58%
jan 1, 1964
8.155
+2.318
39.7%
jan 1, 1965
10.187
+2.032
24.91%
jan 1, 1966
8.705
-1.482
-14.55%
jan 1, 1967
8.5
-0.205
-2.36%
jan 1, 1968
6.131
-2.369
-27.88%
jan 1, 1969
5.746
-0.385
-6.28%
jan 1, 1970
4.832
-0.913
-15.9%
jan 1, 1971
6.372
+1.54
31.86%
jan 1, 1972
5.925
-0.447
-7.01%
jan 1, 1973
7.813
+1.888
31.87%
jan 1, 1974
7.159
-0.654
-8.38%
jan 1, 1975
7.543
+0.384
5.36%
jan 1, 1976
8.879
+1.336
17.71%
jan 1, 1977
7.515
-1.364
-15.36%
jan 1, 1978
6.453
-1.063
-14.14%
jan 1, 1979
6.693
+0.241
3.73%
jan 1, 1980
7.9
+1.207
18.03%
jan 1, 1981
8.558
+0.658
8.33%
jan 1, 1982
8.105
-0.453
-5.29%
jan 1, 1983
7.924
-0.181
-2.24%
jan 1, 1984
7.052
-0.871
-11.0%
jan 1, 1985
6.146
-0.906
-12.85%
jan 1, 1986
6.101
-0.045
-0.74%
jan 1, 1987
5.649
-0.451
-7.39%
jan 1, 1988
5.691
+0.042
0.74%
jan 1, 1989
5.614
-0.077
-1.35%
jan 1, 1990
5.45
-0.164
-2.93%
jan 1, 1991
1.672
-3.778
-69.32%
jan 1, 1992
1.887
+0.215
12.86%
jan 1, 1993
1.575
-0.312
-16.55%
jan 1, 1994
0.617
-0.958
-60.81%
jan 1, 1995
0.619
+0.001
0.24%
jan 1, 1996
0.711
+0.092
14.89%
jan 1, 1997
0.556
-0.155
-21.76%
jan 1, 1998
0.043
-0.513
-92.19%
jan 1, 1999
0.026
-0.018
-40.6%
jan 1, 2000
0.02
-0.006
-23.08%
jan 1, 2001
0.015
-0.004
-22.16%
jan 1, 2002
0.027
+0.012
77.12%
jan 1, 2003
0.017
-0.011
-38.89%
jan 1, 2004
0.025
+0.008
50.5%
jan 1, 2005
0.027
+0.001
5.7%
jan 1, 2006
0.033
+0.006
24.0%
jan 1, 2007
0.033
0.0
-1.29%
jan 1, 2008
0.047
+0.014
43.49%
jan 1, 2009
0.153
+0.107
228.11%
jan 1, 2010
0.042
-0.112
-72.9%
jan 1, 2011
0.037
-0.004
-10.18%
jan 1, 2012
0.072
+0.035
93.47%
jan 1, 2013
0.057
-0.016
-21.47%
jan 1, 2014
0.048
-0.008
-14.6%
jan 1, 2015
0.022
-0.026
-54.69%
Ranking of countries by current statistics by years


Comments: