29
/
en
AIzaSyAYiBZKx7MnpbEhh9jyipgxe19OcubqV5w
April 1, 2024
207028
Nepal
NPL
true
2
1
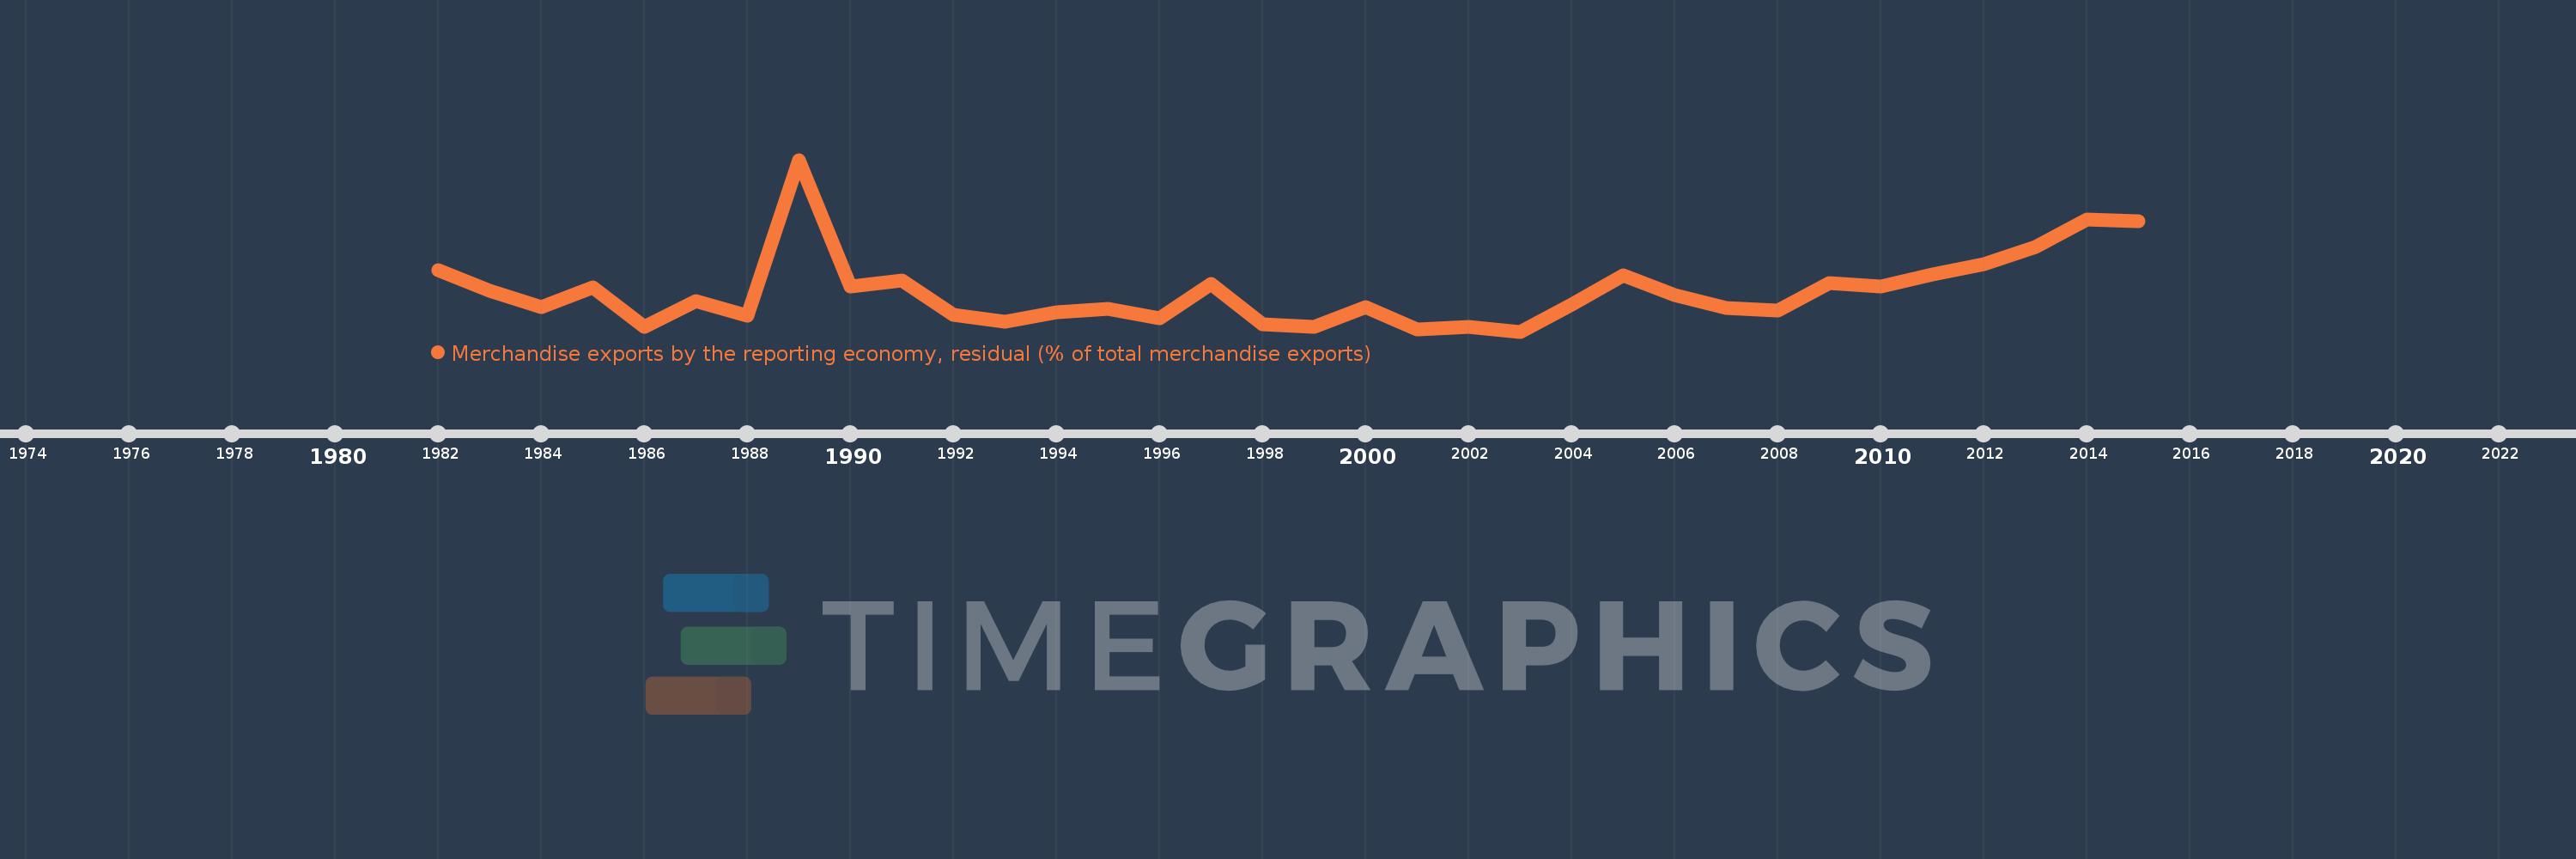
Merchandise exports by the reporting economy, residual (% of total merchandise exports)
2015,2014,2013,2012,2011,2010,2009,2008,2007,2006,2005,2004,2003,2002,2001,2000,1999,1998,1997,1996,1995,1994,1993,1992,1991,1990,1989,1988,1987,1986,1985,1984,1983,1982
This statistics in other country:
AfghanistanAlbaniaAlgeriaAmerican SamoaAngolaAntigua and BarbudaArab WorldArgentinaArmeniaArubaAustraliaAustriaAzerbaijanBahamas, TheBahrainBangladeshBarbadosBelarusBelgiumBelizeBeninBermudaBoliviaBosnia and HerzegovinaBrazilBrunei DarussalamBulgariaBurkina FasoBurundiCabo VerdeCambodiaCameroonCanadaCaribbean small statesCentral African RepublicCentral Europe and the BalticsChadChileChinaColombiaComorosCongo, Dem. Rep.Congo, Rep.Costa RicaCote d'IvoireCroatiaCubaCyprusCzech RepublicDenmarkDjiboutiDominicaDominican RepublicEarly-demographic dividendEast Asia & PacificEast Asia & Pacific (excluding high income)East Asia & Pacific (IDA & IBRD countries)EcuadorEgypt, Arab Rep.El SalvadorEquatorial GuineaEstoniaEthiopiaEuro areaEurope & Central AsiaEurope & Central Asia (excluding high income)Europe & Central Asia (IDA & IBRD countries)European UnionFaroe IslandsFijiFinlandFragile and conflict affected situationsFranceFrench PolynesiaGabonGambia, TheGeorgiaGermanyGhanaGibraltarGreeceGreenlandGrenadaGuamGuatemalaGuineaGuinea-BissauGuyanaHaitiHeavily indebted poor countries (HIPC)High incomeHondurasHong Kong SAR, ChinaHungaryIBRD onlyIcelandIDA & IBRD totalIDA blendIDA onlyIDA totalIndiaIndonesiaIran, Islamic Rep.IraqIrelandIsraelItalyJamaicaJapanJordanKazakhstanKenyaKiribatiKorea, Dem. People’s Rep.Korea, Rep.KosovoKuwaitKyrgyz RepublicLao PDRLate-demographic dividendLatin America & Caribbean Latin America & Caribbean (excluding high income)Latin America & the Caribbean (IDA & IBRD countries)LatviaLeast developed countries: UN classificationLebanonLiberiaLibyaLithuaniaLow & middle incomeLow incomeLower middle incomeLuxembourgMacao SAR, ChinaMacedonia, FYRMadagascarMalawiMalaysiaMaldivesMaliMaltaMauritaniaMauritiusMexicoMiddle East & North AfricaMiddle East & North Africa (excluding high income)Middle East & North Africa (IDA & IBRD countries)Middle incomeMoldovaMongoliaMontenegroMoroccoMozambiqueMyanmarNauruNepalNetherlandsNew CaledoniaNew ZealandNicaraguaNigerNigeriaNorth AmericaNorwayOECD membersOmanOther small statesPacific island small statesPakistanPanamaPapua New GuineaParaguayPeruPhilippinesPolandPortugalPost-demographic dividendPre-demographic dividendQatarRomaniaRussian FederationRwandaSamoaSao Tome and PrincipeSaudi ArabiaSenegalSerbiaSeychellesSierra LeoneSingaporeSlovak RepublicSloveniaSmall statesSolomon IslandsSomaliaSouth AfricaSouth AsiaSouth Asia (IDA & IBRD)SpainSri LankaSt. Kitts and NevisSt. LuciaSt. Vincent and the GrenadinesSub-Saharan Africa Sub-Saharan Africa (excluding high income)Sub-Saharan Africa (IDA & IBRD countries)SudanSurinameSwedenSwitzerlandSyrian Arab RepublicTajikistanTanzaniaThailandTogoTongaTrinidad and TobagoTunisiaTurkeyTurkmenistanTuvaluUgandaUkraineUnited Arab EmiratesUnited KingdomUnited StatesUpper middle incomeUruguayUzbekistanVanuatuVenezuela, RBVietnamWorldYemen, Rep.ZambiaZimbabwe Timeline:
This timeline shows a graph from 1982 to 2015 of Nepal. No data until 1981. Number of actual observations by date: 34.
Source name:
World Development Indicators
Source organization:
World Bank staff estimates based data from International Monetary Fund's Direction of Trade database.
Categories, topics:
Private Sector, Trade
Last updated:
apr 23, 2017
Indicators value changes by year
Maximum:
15.216
jan 1, 1989
At the date of observation
Value
Absolute change
Change from previous value
jan 1, 1982
6.456
+6.456
0.0%
jan 1, 1983
4.8
-1.655
-25.64%
jan 1, 1984
3.525
-1.276
-26.58%
jan 1, 1985
5.124
+1.599
45.38%
jan 1, 1986
1.987
-3.137
-61.22%
jan 1, 1987
4.006
+2.019
101.57%
jan 1, 1988
2.873
-1.133
-28.28%
jan 1, 1989
15.216
+12.343
429.6%
jan 1, 1990
5.158
-10.058
-66.1%
jan 1, 1991
5.633
+0.475
9.22%
jan 1, 1992
2.947
-2.686
-47.69%
jan 1, 1993
2.364
-0.583
-19.78%
jan 1, 1994
3.119
+0.755
31.95%
jan 1, 1995
3.428
+0.308
9.88%
jan 1, 1996
2.645
-0.782
-22.82%
jan 1, 1997
5.387
+2.742
103.65%
jan 1, 1998
2.142
-3.246
-60.25%
jan 1, 1999
1.984
-0.158
-7.37%
jan 1, 2000
3.542
+1.559
78.57%
jan 1, 2001
1.776
-1.766
-49.86%
jan 1, 2002
1.977
+0.201
11.34%
jan 1, 2003
1.589
-0.388
-19.62%
jan 1, 2004
3.743
+2.154
135.5%
jan 1, 2005
6.059
+2.316
61.87%
jan 1, 2006
4.479
-1.579
-26.07%
jan 1, 2007
3.441
-1.038
-23.18%
jan 1, 2008
3.26
-0.181
-5.26%
jan 1, 2009
5.408
+2.148
65.89%
jan 1, 2010
5.146
-0.263
-4.86%
jan 1, 2011
6.143
+0.997
19.38%
jan 1, 2012
6.97
+0.827
13.47%
jan 1, 2013
8.27
+1.299
18.64%
jan 1, 2014
10.481
+2.212
26.75%
jan 1, 2015
10.366
-0.116
-1.1%
Ranking of countries by current statistics by years


Comments: