29
/
en
AIzaSyAYiBZKx7MnpbEhh9jyipgxe19OcubqV5w
April 1, 2024
208184
Netherlands
NLD
true
2
1
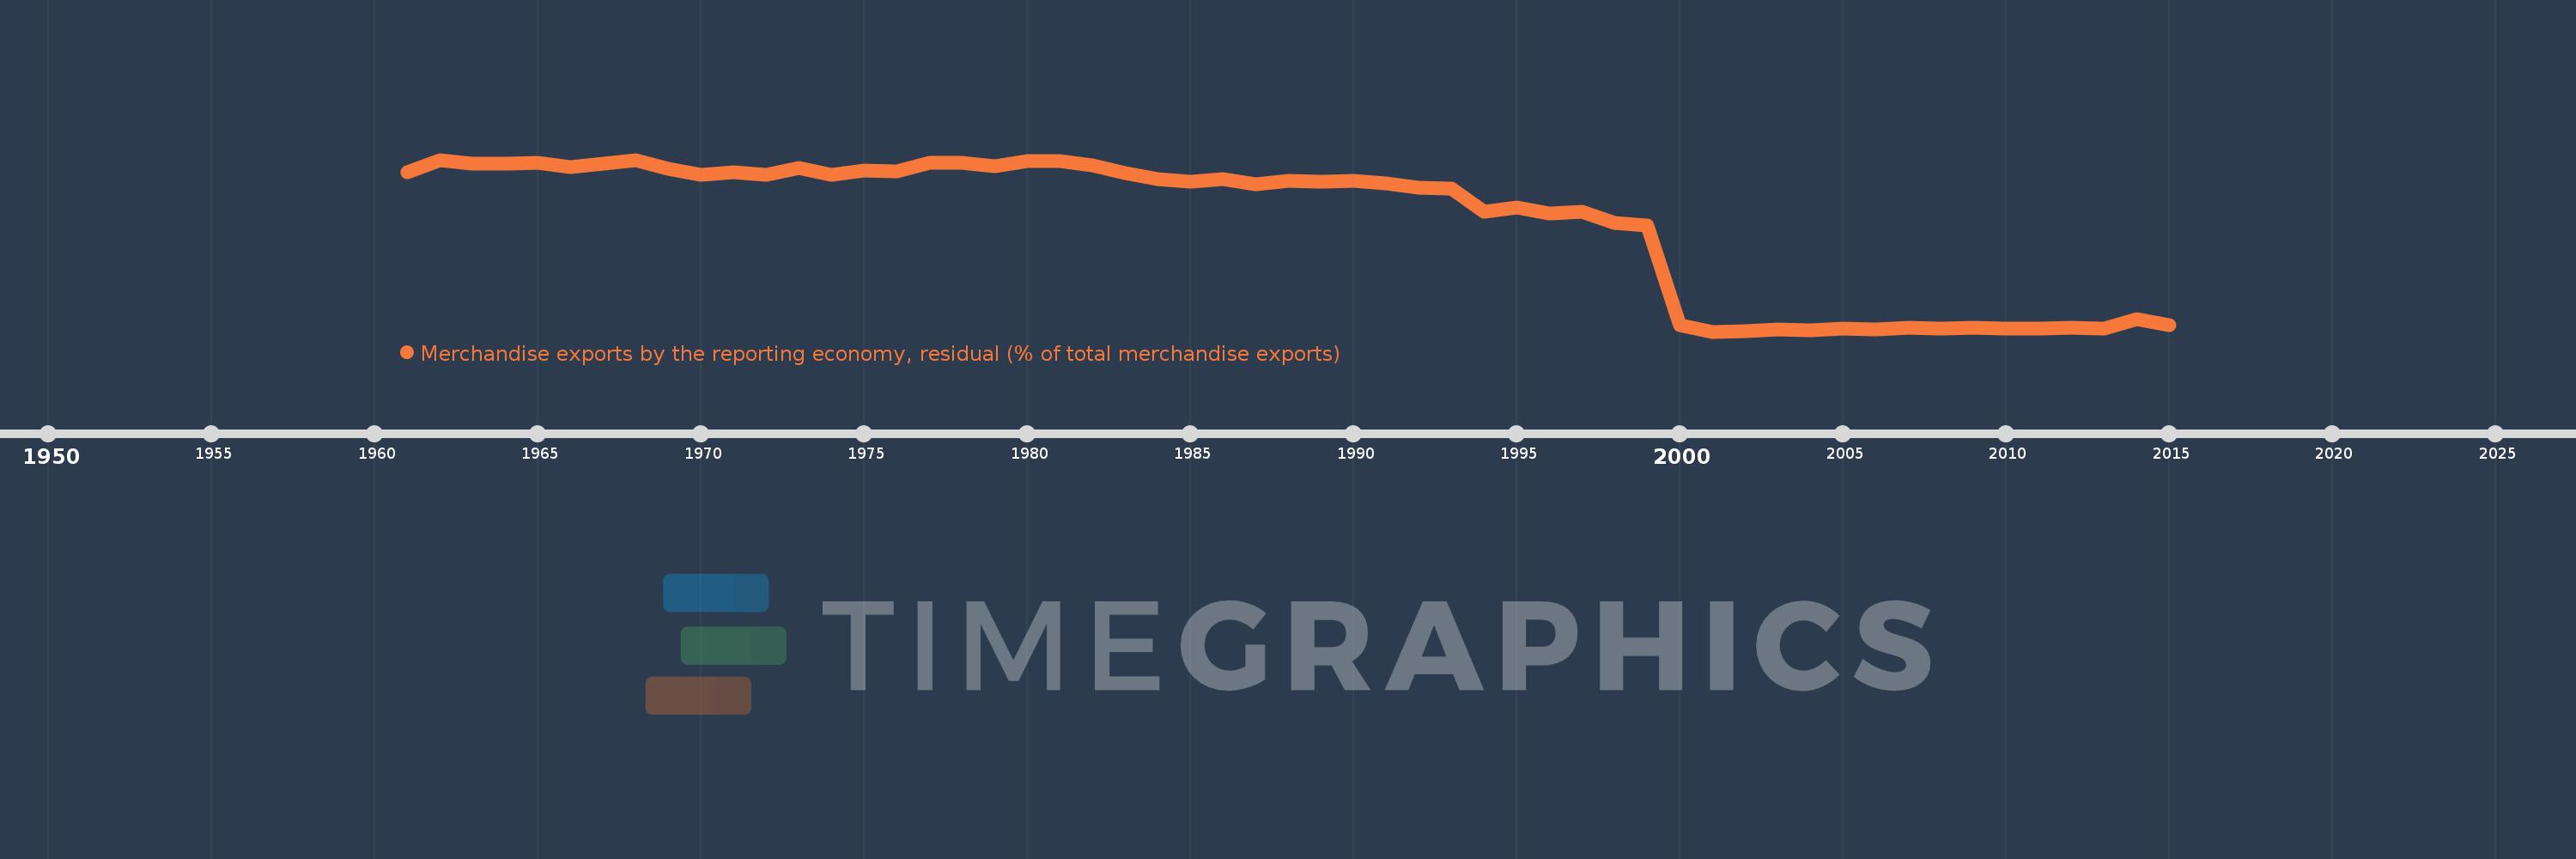
Merchandise exports by the reporting economy, residual (% of total merchandise exports)
2015,2014,2013,2012,2011,2010,2009,2008,2007,2006,2005,2004,2003,2002,2001,2000,1999,1998,1997,1996,1995,1994,1993,1992,1991,1990,1989,1988,1987,1986,1985,1984,1983,1982,1981,1980,1979,1978,1977,1976,1975,1974,1973,1972,1971,1970,1969,1968,1967,1966,1965,1964,1963,1962,1961
This statistics in other country:
AfghanistanAlbaniaAlgeriaAmerican SamoaAngolaAntigua and BarbudaArab WorldArgentinaArmeniaArubaAustraliaAustriaAzerbaijanBahamas, TheBahrainBangladeshBarbadosBelarusBelgiumBelizeBeninBermudaBoliviaBosnia and HerzegovinaBrazilBrunei DarussalamBulgariaBurkina FasoBurundiCabo VerdeCambodiaCameroonCanadaCaribbean small statesCentral African RepublicCentral Europe and the BalticsChadChileChinaColombiaComorosCongo, Dem. Rep.Congo, Rep.Costa RicaCote d'IvoireCroatiaCubaCyprusCzech RepublicDenmarkDjiboutiDominicaDominican RepublicEarly-demographic dividendEast Asia & PacificEast Asia & Pacific (excluding high income)East Asia & Pacific (IDA & IBRD countries)EcuadorEgypt, Arab Rep.El SalvadorEquatorial GuineaEstoniaEthiopiaEuro areaEurope & Central AsiaEurope & Central Asia (excluding high income)Europe & Central Asia (IDA & IBRD countries)European UnionFaroe IslandsFijiFinlandFragile and conflict affected situationsFranceFrench PolynesiaGabonGambia, TheGeorgiaGermanyGhanaGibraltarGreeceGreenlandGrenadaGuamGuatemalaGuineaGuinea-BissauGuyanaHaitiHeavily indebted poor countries (HIPC)High incomeHondurasHong Kong SAR, ChinaHungaryIBRD onlyIcelandIDA & IBRD totalIDA blendIDA onlyIDA totalIndiaIndonesiaIran, Islamic Rep.IraqIrelandIsraelItalyJamaicaJapanJordanKazakhstanKenyaKiribatiKorea, Dem. People’s Rep.Korea, Rep.KosovoKuwaitKyrgyz RepublicLao PDRLate-demographic dividendLatin America & Caribbean Latin America & Caribbean (excluding high income)Latin America & the Caribbean (IDA & IBRD countries)LatviaLeast developed countries: UN classificationLebanonLiberiaLibyaLithuaniaLow & middle incomeLow incomeLower middle incomeLuxembourgMacao SAR, ChinaMacedonia, FYRMadagascarMalawiMalaysiaMaldivesMaliMaltaMauritaniaMauritiusMexicoMiddle East & North AfricaMiddle East & North Africa (excluding high income)Middle East & North Africa (IDA & IBRD countries)Middle incomeMoldovaMongoliaMontenegroMoroccoMozambiqueMyanmarNauruNepalNetherlandsNew CaledoniaNew ZealandNicaraguaNigerNigeriaNorth AmericaNorwayOECD membersOmanOther small statesPacific island small statesPakistanPanamaPapua New GuineaParaguayPeruPhilippinesPolandPortugalPost-demographic dividendPre-demographic dividendQatarRomaniaRussian FederationRwandaSamoaSao Tome and PrincipeSaudi ArabiaSenegalSerbiaSeychellesSierra LeoneSingaporeSlovak RepublicSloveniaSmall statesSolomon IslandsSomaliaSouth AfricaSouth AsiaSouth Asia (IDA & IBRD)SpainSri LankaSt. Kitts and NevisSt. LuciaSt. Vincent and the GrenadinesSub-Saharan Africa Sub-Saharan Africa (excluding high income)Sub-Saharan Africa (IDA & IBRD countries)SudanSurinameSwedenSwitzerlandSyrian Arab RepublicTajikistanTanzaniaThailandTogoTongaTrinidad and TobagoTunisiaTurkeyTurkmenistanTuvaluUgandaUkraineUnited Arab EmiratesUnited KingdomUnited StatesUpper middle incomeUruguayUzbekistanVanuatuVenezuela, RBVietnamWorldYemen, Rep.ZambiaZimbabwe Timeline:
This timeline shows a graph from 1961 to 2015 of Netherlands. No data until 1960. Number of actual observations by date: 55.
Source name:
World Development Indicators
Source organization:
World Bank staff estimates based data from International Monetary Fund's Direction of Trade database.
Categories, topics:
Private Sector, Trade
Last updated:
apr 23, 2017
Indicators value changes by year
Maximum:
19.217
jan 1, 1962
At the date of observation
Value
Absolute change
Change from previous value
jan 1, 1961
17.915
+17.915
0.0%
jan 1, 1962
19.217
+1.302
7.27%
jan 1, 1963
18.84
-0.378
-1.96%
jan 1, 1964
18.837
-0.003
-0.02%
jan 1, 1965
18.863
+0.027
0.14%
jan 1, 1966
18.453
-0.411
-2.18%
jan 1, 1967
18.759
+0.307
1.66%
jan 1, 1968
19.203
+0.444
2.37%
jan 1, 1969
18.254
-0.949
-4.94%
jan 1, 1970
17.591
-0.663
-3.63%
jan 1, 1971
17.874
+0.283
1.61%
jan 1, 1972
17.634
-0.24
-1.34%
jan 1, 1973
18.332
+0.698
3.96%
jan 1, 1974
17.616
-0.716
-3.9%
jan 1, 1975
18.089
+0.473
2.68%
jan 1, 1976
17.968
-0.121
-0.67%
jan 1, 1977
18.869
+0.901
5.02%
jan 1, 1978
18.881
+0.012
0.06%
jan 1, 1979
18.512
-0.369
-1.95%
jan 1, 1980
19.069
+0.558
3.01%
jan 1, 1981
19.124
+0.055
0.29%
jan 1, 1982
18.617
-0.507
-2.65%
jan 1, 1983
17.748
-0.869
-4.67%
jan 1, 1984
17.117
-0.631
-3.55%
jan 1, 1985
16.841
-0.276
-1.62%
jan 1, 1986
17.139
+0.298
1.77%
jan 1, 1987
16.557
-0.582
-3.4%
jan 1, 1988
16.92
+0.363
2.19%
jan 1, 1989
16.848
-0.072
-0.42%
jan 1, 1990
16.966
+0.118
0.7%
jan 1, 1991
16.674
-0.291
-1.72%
jan 1, 1992
16.196
-0.479
-2.87%
jan 1, 1993
16.12
-0.076
-0.47%
jan 1, 1994
13.613
-2.507
-15.55%
jan 1, 1995
14.141
+0.528
3.88%
jan 1, 1996
13.465
-0.676
-4.78%
jan 1, 1997
13.643
+0.178
1.32%
jan 1, 1998
12.458
-1.185
-8.68%
jan 1, 1999
12.175
-0.283
-2.27%
jan 1, 2000
1.46
-10.715
-88.01%
jan 1, 2001
0.778
-0.682
-46.7%
jan 1, 2002
0.782
+0.004
0.51%
jan 1, 2003
0.973
+0.192
24.49%
jan 1, 2004
0.885
-0.088
-9.09%
jan 1, 2005
1.103
+0.218
24.63%
jan 1, 2006
0.968
-0.135
-12.21%
jan 1, 2007
1.173
+0.205
21.17%
jan 1, 2008
1.076
-0.097
-8.27%
jan 1, 2009
1.158
+0.082
7.6%
jan 1, 2010
1.092
-0.066
-5.71%
jan 1, 2011
1.111
+0.019
1.78%
jan 1, 2012
1.153
+0.042
3.75%
jan 1, 2013
1.099
-0.054
-4.67%
jan 1, 2014
2.085
+0.985
89.63%
jan 1, 2015
1.483
-0.601
-28.83%
Ranking of countries by current statistics by years


Comments: