29
/
en
AIzaSyAYiBZKx7MnpbEhh9jyipgxe19OcubqV5w
April 1, 2024
262531
Thailand
THA
true
2
1
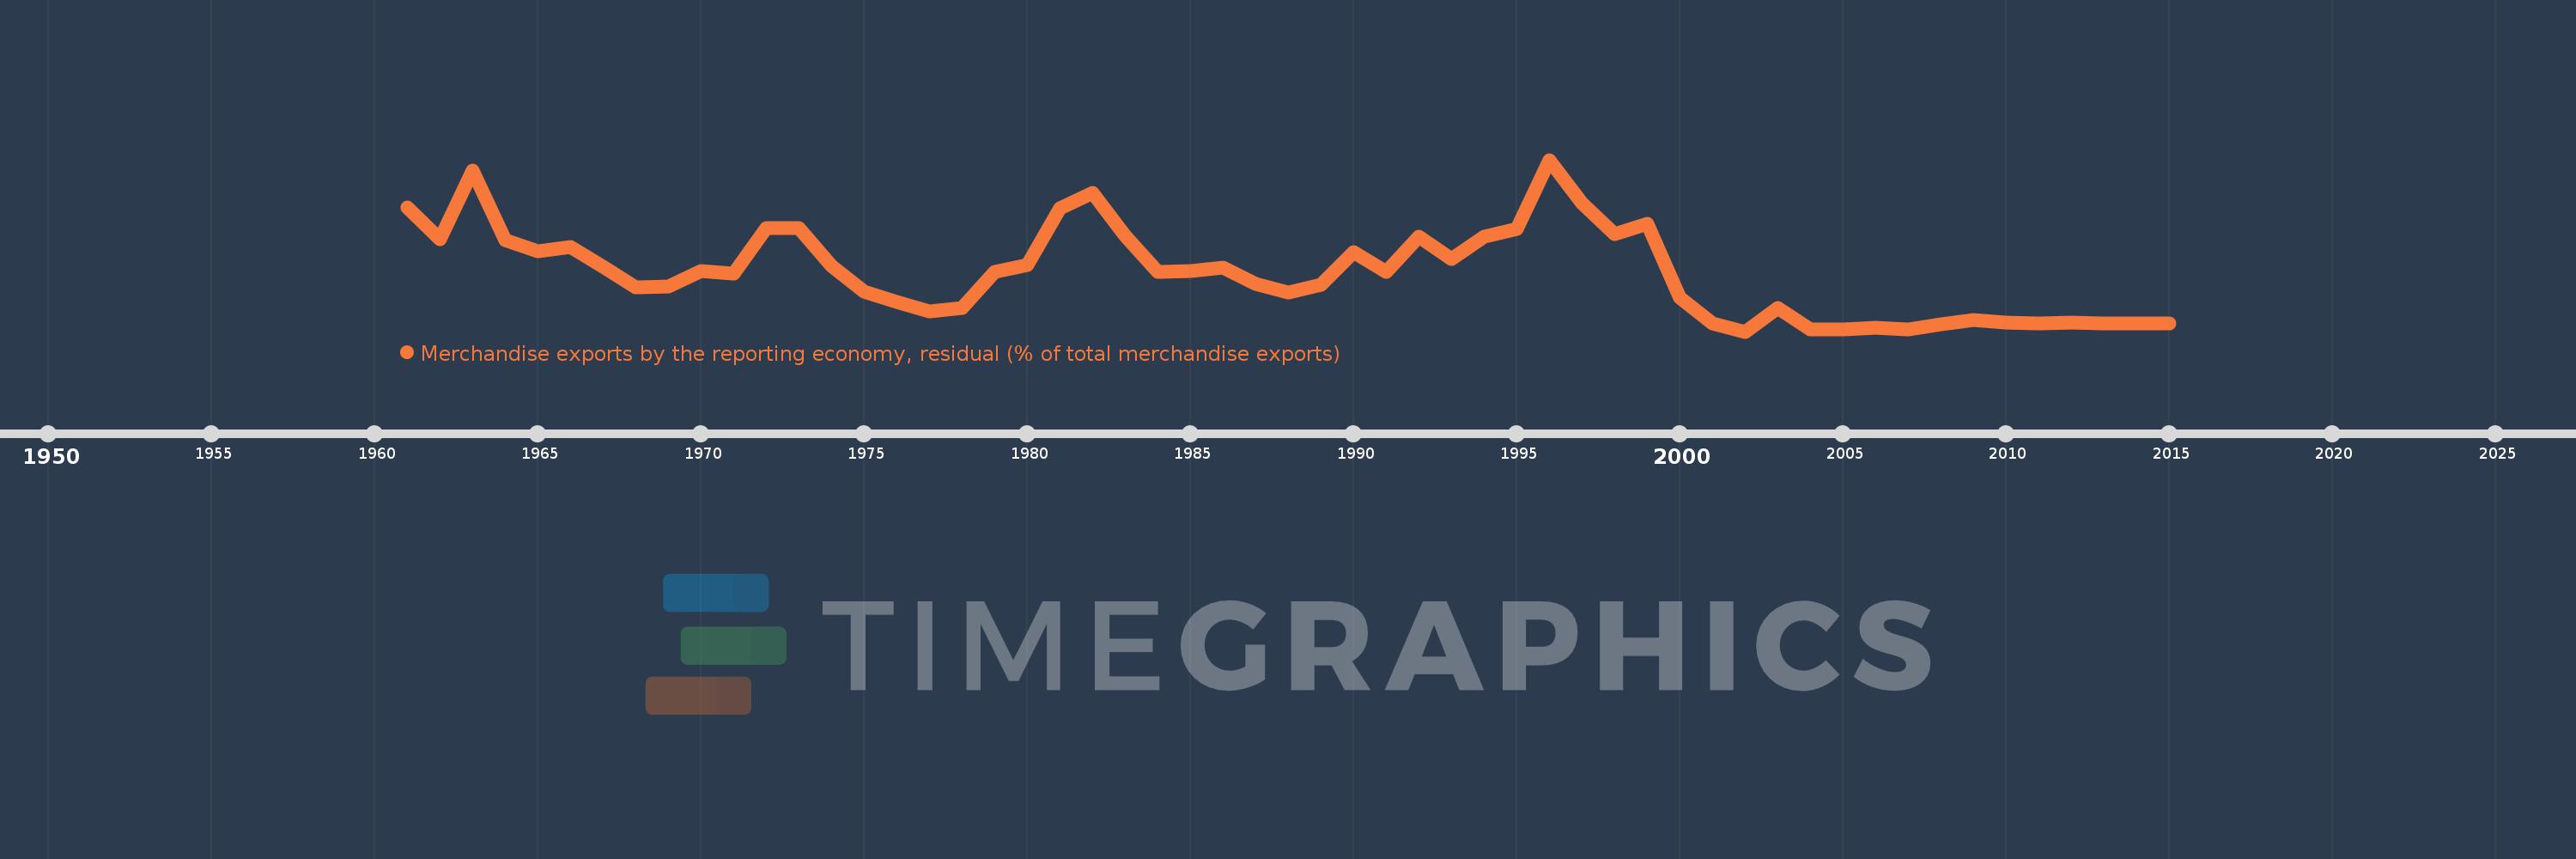
Merchandise exports by the reporting economy, residual (% of total merchandise exports)
2015,2014,2013,2012,2011,2010,2009,2008,2007,2006,2005,2004,2003,2002,2001,2000,1999,1998,1997,1996,1995,1994,1993,1992,1991,1990,1989,1988,1987,1986,1985,1984,1983,1982,1981,1980,1979,1978,1977,1976,1975,1974,1973,1972,1971,1970,1969,1968,1967,1966,1965,1964,1963,1962,1961
This statistics in other country:
AfghanistanAlbaniaAlgeriaAmerican SamoaAngolaAntigua and BarbudaArab WorldArgentinaArmeniaArubaAustraliaAustriaAzerbaijanBahamas, TheBahrainBangladeshBarbadosBelarusBelgiumBelizeBeninBermudaBoliviaBosnia and HerzegovinaBrazilBrunei DarussalamBulgariaBurkina FasoBurundiCabo VerdeCambodiaCameroonCanadaCaribbean small statesCentral African RepublicCentral Europe and the BalticsChadChileChinaColombiaComorosCongo, Dem. Rep.Congo, Rep.Costa RicaCote d'IvoireCroatiaCubaCyprusCzech RepublicDenmarkDjiboutiDominicaDominican RepublicEarly-demographic dividendEast Asia & PacificEast Asia & Pacific (excluding high income)East Asia & Pacific (IDA & IBRD countries)EcuadorEgypt, Arab Rep.El SalvadorEquatorial GuineaEstoniaEthiopiaEuro areaEurope & Central AsiaEurope & Central Asia (excluding high income)Europe & Central Asia (IDA & IBRD countries)European UnionFaroe IslandsFijiFinlandFragile and conflict affected situationsFranceFrench PolynesiaGabonGambia, TheGeorgiaGermanyGhanaGibraltarGreeceGreenlandGrenadaGuamGuatemalaGuineaGuinea-BissauGuyanaHaitiHeavily indebted poor countries (HIPC)High incomeHondurasHong Kong SAR, ChinaHungaryIBRD onlyIcelandIDA & IBRD totalIDA blendIDA onlyIDA totalIndiaIndonesiaIran, Islamic Rep.IraqIrelandIsraelItalyJamaicaJapanJordanKazakhstanKenyaKiribatiKorea, Dem. People’s Rep.Korea, Rep.KosovoKuwaitKyrgyz RepublicLao PDRLate-demographic dividendLatin America & Caribbean Latin America & Caribbean (excluding high income)Latin America & the Caribbean (IDA & IBRD countries)LatviaLeast developed countries: UN classificationLebanonLiberiaLibyaLithuaniaLow & middle incomeLow incomeLower middle incomeLuxembourgMacao SAR, ChinaMacedonia, FYRMadagascarMalawiMalaysiaMaldivesMaliMaltaMauritaniaMauritiusMexicoMiddle East & North AfricaMiddle East & North Africa (excluding high income)Middle East & North Africa (IDA & IBRD countries)Middle incomeMoldovaMongoliaMontenegroMoroccoMozambiqueMyanmarNauruNepalNetherlandsNew CaledoniaNew ZealandNicaraguaNigerNigeriaNorth AmericaNorwayOECD membersOmanOther small statesPacific island small statesPakistanPanamaPapua New GuineaParaguayPeruPhilippinesPolandPortugalPost-demographic dividendPre-demographic dividendQatarRomaniaRussian FederationRwandaSamoaSao Tome and PrincipeSaudi ArabiaSenegalSerbiaSeychellesSierra LeoneSingaporeSlovak RepublicSloveniaSmall statesSolomon IslandsSomaliaSouth AfricaSouth AsiaSouth Asia (IDA & IBRD)SpainSri LankaSt. Kitts and NevisSt. LuciaSt. Vincent and the GrenadinesSub-Saharan Africa Sub-Saharan Africa (excluding high income)Sub-Saharan Africa (IDA & IBRD countries)SudanSurinameSwedenSwitzerlandSyrian Arab RepublicTajikistanTanzaniaThailandTogoTongaTrinidad and TobagoTunisiaTurkeyTurkmenistanTuvaluUgandaUkraineUnited Arab EmiratesUnited KingdomUnited StatesUpper middle incomeUruguayUzbekistanVanuatuVenezuela, RBVietnamWorldYemen, Rep.ZambiaZimbabwe Timeline:
This timeline shows a graph from 1961 to 2015 of Thailand. No data until 1960. Number of actual observations by date: 55.
Source name:
World Development Indicators
Source organization:
World Bank staff estimates based data from International Monetary Fund's Direction of Trade database.
Categories, topics:
Private Sector, Trade
Last updated:
apr 23, 2017
Indicators value changes by year
At the date of observation
Value
Absolute change
Change from previous value
jan 1, 1961
5.433
+5.433
0.0%
jan 1, 1962
4.083
-1.35
-24.84%
jan 1, 1963
7.007
+2.924
71.61%
jan 1, 1964
4.048
-2.959
-42.22%
jan 1, 1965
3.58
-0.468
-11.57%
jan 1, 1966
3.769
+0.189
5.27%
jan 1, 1967
2.901
-0.868
-23.02%
jan 1, 1968
2.05
-0.851
-29.34%
jan 1, 1969
2.078
+0.028
1.37%
jan 1, 1970
2.722
+0.644
31.0%
jan 1, 1971
2.631
-0.091
-3.34%
jan 1, 1972
4.578
+1.946
73.97%
jan 1, 1973
4.55
-0.028
-0.62%
jan 1, 1974
2.962
-1.587
-34.89%
jan 1, 1975
1.858
-1.105
-37.29%
jan 1, 1976
1.426
-0.432
-23.25%
jan 1, 1977
1.03
-0.396
-27.78%
jan 1, 1978
1.178
+0.148
14.39%
jan 1, 1979
2.686
+1.508
128.03%
jan 1, 1980
2.981
+0.295
10.99%
jan 1, 1981
5.411
+2.43
81.51%
jan 1, 1982
6.062
+0.65
12.02%
jan 1, 1983
4.231
-1.831
-30.2%
jan 1, 1984
2.707
-1.524
-36.02%
jan 1, 1985
2.721
+0.014
0.51%
jan 1, 1986
2.877
+0.156
5.73%
jan 1, 1987
2.182
-0.695
-24.16%
jan 1, 1988
1.807
-0.374
-17.17%
jan 1, 1989
2.135
+0.328
18.15%
jan 1, 1990
3.52
+1.385
64.87%
jan 1, 1991
2.695
-0.825
-23.44%
jan 1, 1992
4.19
+1.495
55.49%
jan 1, 1993
3.245
-0.945
-22.55%
jan 1, 1994
4.205
+0.96
29.58%
jan 1, 1995
4.52
+0.314
7.47%
jan 1, 1996
7.463
+2.943
65.11%
jan 1, 1997
5.602
-1.861
-24.94%
jan 1, 1998
4.305
-1.296
-23.14%
jan 1, 1999
4.732
+0.426
9.9%
jan 1, 2000
1.614
-3.118
-65.89%
jan 1, 2001
0.51
-1.104
-68.39%
jan 1, 2002
0.16
-0.35
-68.68%
jan 1, 2003
1.165
+1.005
629.2%
jan 1, 2004
0.255
-0.91
-78.13%
jan 1, 2005
0.267
+0.012
4.74%
jan 1, 2006
0.328
+0.061
22.76%
jan 1, 2007
0.253
-0.075
-22.78%
jan 1, 2008
0.455
+0.202
79.69%
jan 1, 2009
0.636
+0.181
39.84%
jan 1, 2010
0.556
-0.08
-12.6%
jan 1, 2011
0.516
-0.039
-7.04%
jan 1, 2012
0.556
+0.039
7.62%
jan 1, 2013
0.491
-0.065
-11.64%
jan 1, 2014
0.523
+0.032
6.42%
jan 1, 2015
0.507
-0.015
-2.89%
Ranking of countries by current statistics by years


Comments: