29
/
en
AIzaSyAYiBZKx7MnpbEhh9jyipgxe19OcubqV5w
April 1, 2024
139515
Germany
DEU
true
2
1
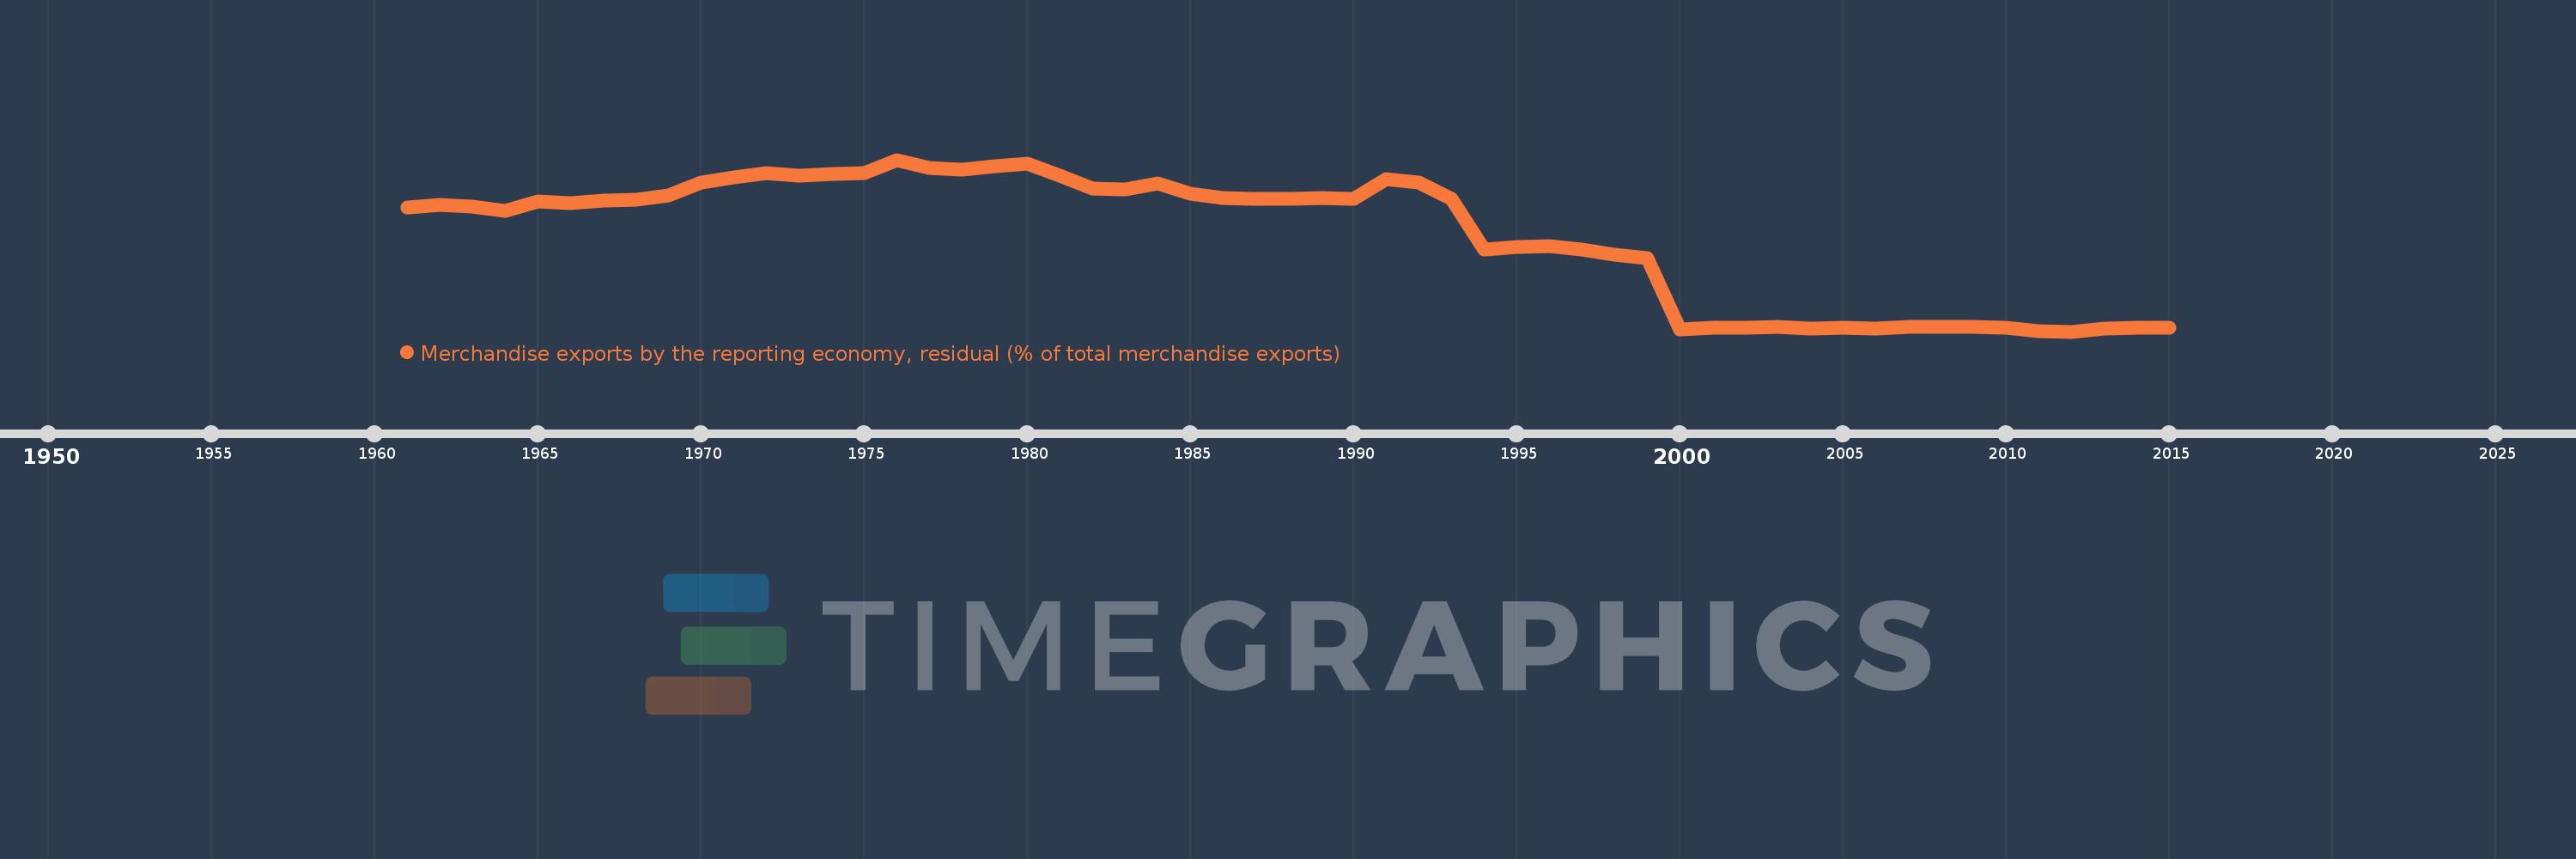
Merchandise exports by the reporting economy, residual (% of total merchandise exports)
2015,2014,2013,2012,2011,2010,2009,2008,2007,2006,2005,2004,2003,2002,2001,2000,1999,1998,1997,1996,1995,1994,1993,1992,1991,1990,1989,1988,1987,1986,1985,1984,1983,1982,1981,1980,1979,1978,1977,1976,1975,1974,1973,1972,1971,1970,1969,1968,1967,1966,1965,1964,1963,1962,1961
This statistics in other country:
AfghanistanAlbaniaAlgeriaAmerican SamoaAngolaAntigua and BarbudaArab WorldArgentinaArmeniaArubaAustraliaAustriaAzerbaijanBahamas, TheBahrainBangladeshBarbadosBelarusBelgiumBelizeBeninBermudaBoliviaBosnia and HerzegovinaBrazilBrunei DarussalamBulgariaBurkina FasoBurundiCabo VerdeCambodiaCameroonCanadaCaribbean small statesCentral African RepublicCentral Europe and the BalticsChadChileChinaColombiaComorosCongo, Dem. Rep.Congo, Rep.Costa RicaCote d'IvoireCroatiaCubaCyprusCzech RepublicDenmarkDjiboutiDominicaDominican RepublicEarly-demographic dividendEast Asia & PacificEast Asia & Pacific (excluding high income)East Asia & Pacific (IDA & IBRD countries)EcuadorEgypt, Arab Rep.El SalvadorEquatorial GuineaEstoniaEthiopiaEuro areaEurope & Central AsiaEurope & Central Asia (excluding high income)Europe & Central Asia (IDA & IBRD countries)European UnionFaroe IslandsFijiFinlandFragile and conflict affected situationsFranceFrench PolynesiaGabonGambia, TheGeorgiaGermanyGhanaGibraltarGreeceGreenlandGrenadaGuamGuatemalaGuineaGuinea-BissauGuyanaHaitiHeavily indebted poor countries (HIPC)High incomeHondurasHong Kong SAR, ChinaHungaryIBRD onlyIcelandIDA & IBRD totalIDA blendIDA onlyIDA totalIndiaIndonesiaIran, Islamic Rep.IraqIrelandIsraelItalyJamaicaJapanJordanKazakhstanKenyaKiribatiKorea, Dem. People’s Rep.Korea, Rep.KosovoKuwaitKyrgyz RepublicLao PDRLate-demographic dividendLatin America & Caribbean Latin America & Caribbean (excluding high income)Latin America & the Caribbean (IDA & IBRD countries)LatviaLeast developed countries: UN classificationLebanonLiberiaLibyaLithuaniaLow & middle incomeLow incomeLower middle incomeLuxembourgMacao SAR, ChinaMacedonia, FYRMadagascarMalawiMalaysiaMaldivesMaliMaltaMauritaniaMauritiusMexicoMiddle East & North AfricaMiddle East & North Africa (excluding high income)Middle East & North Africa (IDA & IBRD countries)Middle incomeMoldovaMongoliaMontenegroMoroccoMozambiqueMyanmarNauruNepalNetherlandsNew CaledoniaNew ZealandNicaraguaNigerNigeriaNorth AmericaNorwayOECD membersOmanOther small statesPacific island small statesPakistanPanamaPapua New GuineaParaguayPeruPhilippinesPolandPortugalPost-demographic dividendPre-demographic dividendQatarRomaniaRussian FederationRwandaSamoaSao Tome and PrincipeSaudi ArabiaSenegalSerbiaSeychellesSierra LeoneSingaporeSlovak RepublicSloveniaSmall statesSolomon IslandsSomaliaSouth AfricaSouth AsiaSouth Asia (IDA & IBRD)SpainSri LankaSt. Kitts and NevisSt. LuciaSt. Vincent and the GrenadinesSub-Saharan Africa Sub-Saharan Africa (excluding high income)Sub-Saharan Africa (IDA & IBRD countries)SudanSurinameSwedenSwitzerlandSyrian Arab RepublicTajikistanTanzaniaThailandTogoTongaTrinidad and TobagoTunisiaTurkeyTurkmenistanTuvaluUgandaUkraineUnited Arab EmiratesUnited KingdomUnited StatesUpper middle incomeUruguayUzbekistanVanuatuVenezuela, RBVietnamWorldYemen, Rep.ZambiaZimbabwe Timeline:
This timeline shows a graph from 1961 to 2015 of Germany. No data until 1960. Number of actual observations by date: 55.
Source name:
World Development Indicators
Source organization:
World Bank staff estimates based data from International Monetary Fund's Direction of Trade database.
Categories, topics:
Private Sector, Trade
Last updated:
apr 23, 2017
Indicators value changes by year
Maximum:
13.914
jan 1, 1976
At the date of observation
Value
Absolute change
Change from previous value
jan 1, 1961
10.069
+10.069
0.0%
jan 1, 1962
10.308
+0.239
2.37%
jan 1, 1963
10.162
-0.146
-1.41%
jan 1, 1964
9.817
-0.345
-3.4%
jan 1, 1965
10.571
+0.754
7.68%
jan 1, 1966
10.427
-0.144
-1.36%
jan 1, 1967
10.677
+0.249
2.39%
jan 1, 1968
10.693
+0.017
0.16%
jan 1, 1969
11.031
+0.337
3.16%
jan 1, 1970
12.084
+1.053
9.54%
jan 1, 1971
12.527
+0.443
3.67%
jan 1, 1972
12.875
+0.348
2.78%
jan 1, 1973
12.608
-0.267
-2.08%
jan 1, 1974
12.775
+0.167
1.33%
jan 1, 1975
12.842
+0.066
0.52%
jan 1, 1976
13.914
+1.072
8.35%
jan 1, 1977
13.28
-0.634
-4.55%
jan 1, 1978
13.114
-0.166
-1.25%
jan 1, 1979
13.398
+0.285
2.17%
jan 1, 1980
13.582
+0.184
1.37%
jan 1, 1981
12.646
-0.937
-6.9%
jan 1, 1982
11.591
-1.055
-8.34%
jan 1, 1983
11.56
-0.031
-0.27%
jan 1, 1984
12.054
+0.495
4.28%
jan 1, 1985
11.162
-0.892
-7.4%
jan 1, 1986
10.855
-0.307
-2.75%
jan 1, 1987
10.795
-0.06
-0.55%
jan 1, 1988
10.75
-0.046
-0.42%
jan 1, 1989
10.833
+0.083
0.77%
jan 1, 1990
10.769
-0.064
-0.59%
jan 1, 1991
12.35
+1.581
14.68%
jan 1, 1992
12.072
-0.278
-2.25%
jan 1, 1993
10.759
-1.313
-10.88%
jan 1, 1994
6.721
-4.038
-37.53%
jan 1, 1995
6.945
+0.224
3.34%
jan 1, 1996
6.96
+0.014
0.21%
jan 1, 1997
6.711
-0.248
-3.57%
jan 1, 1998
6.286
-0.425
-6.34%
jan 1, 1999
6.051
-0.235
-3.74%
jan 1, 2000
0.346
-5.705
-94.28%
jan 1, 2001
0.444
+0.098
28.47%
jan 1, 2002
0.42
-0.024
-5.39%
jan 1, 2003
0.519
+0.099
23.43%
jan 1, 2004
0.39
-0.129
-24.79%
jan 1, 2005
0.428
+0.038
9.72%
jan 1, 2006
0.356
-0.073
-16.95%
jan 1, 2007
0.522
+0.166
46.78%
jan 1, 2008
0.535
+0.013
2.44%
jan 1, 2009
0.509
-0.025
-4.72%
jan 1, 2010
0.483
-0.027
-5.27%
jan 1, 2011
0.143
-0.339
-70.28%
jan 1, 2012
0.141
-0.003
-1.84%
jan 1, 2013
0.41
+0.269
191.14%
jan 1, 2014
0.452
+0.042
10.24%
jan 1, 2015
0.446
-0.006
-1.38%
Ranking of countries by current statistics by years


Comments: