29
/
en
AIzaSyAYiBZKx7MnpbEhh9jyipgxe19OcubqV5w
April 1, 2024
132245
Fiji
FJI
true
2
1
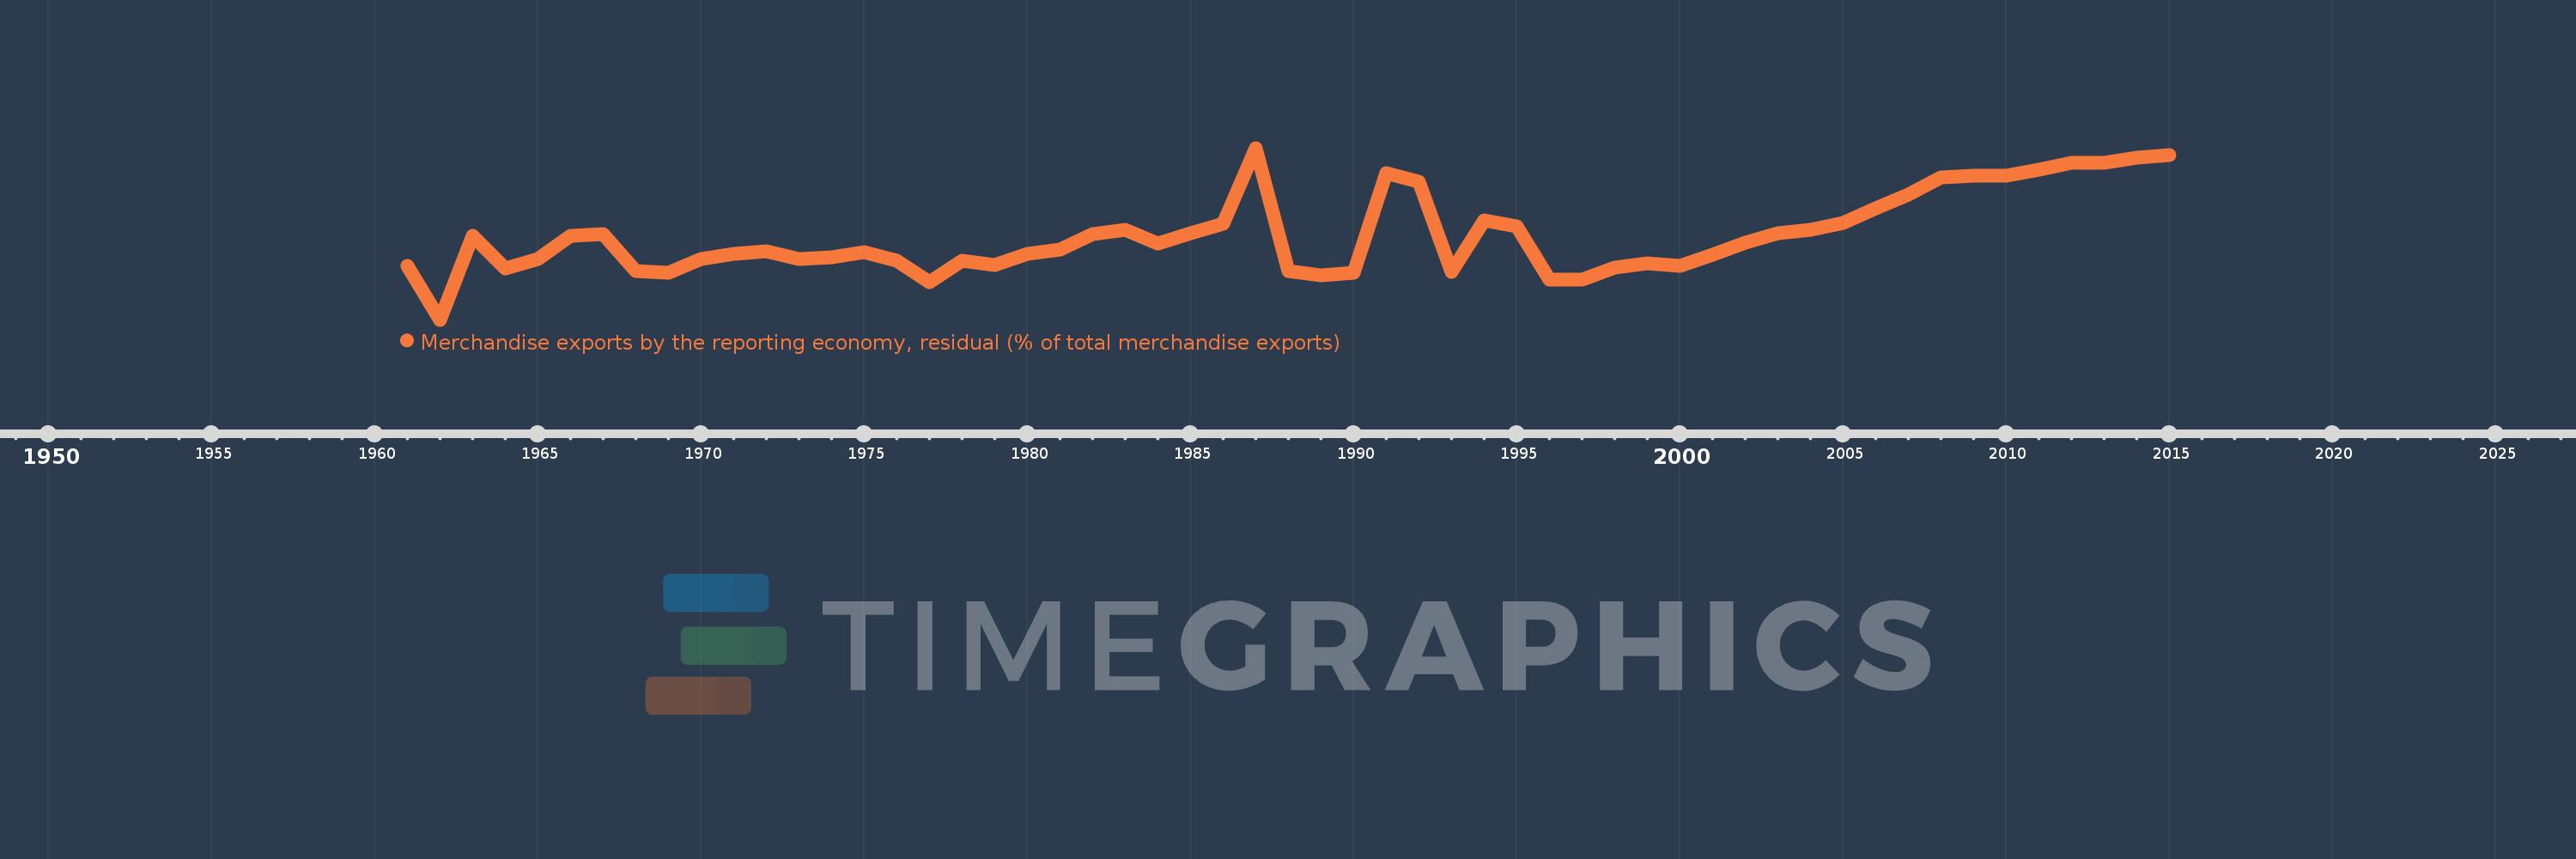
Merchandise exports by the reporting economy, residual (% of total merchandise exports)
2015,2014,2013,2012,2011,2010,2009,2008,2007,2006,2005,2004,2003,2002,2001,2000,1999,1998,1997,1996,1995,1994,1993,1992,1991,1990,1989,1988,1987,1986,1985,1984,1983,1982,1981,1980,1979,1978,1977,1976,1975,1974,1973,1972,1971,1970,1969,1968,1967,1966,1965,1964,1963,1962,1961
This statistics in other country:
AfghanistanAlbaniaAlgeriaAmerican SamoaAngolaAntigua and BarbudaArab WorldArgentinaArmeniaArubaAustraliaAustriaAzerbaijanBahamas, TheBahrainBangladeshBarbadosBelarusBelgiumBelizeBeninBermudaBoliviaBosnia and HerzegovinaBrazilBrunei DarussalamBulgariaBurkina FasoBurundiCabo VerdeCambodiaCameroonCanadaCaribbean small statesCentral African RepublicCentral Europe and the BalticsChadChileChinaColombiaComorosCongo, Dem. Rep.Congo, Rep.Costa RicaCote d'IvoireCroatiaCubaCyprusCzech RepublicDenmarkDjiboutiDominicaDominican RepublicEarly-demographic dividendEast Asia & PacificEast Asia & Pacific (excluding high income)East Asia & Pacific (IDA & IBRD countries)EcuadorEgypt, Arab Rep.El SalvadorEquatorial GuineaEstoniaEthiopiaEuro areaEurope & Central AsiaEurope & Central Asia (excluding high income)Europe & Central Asia (IDA & IBRD countries)European UnionFaroe IslandsFijiFinlandFragile and conflict affected situationsFranceFrench PolynesiaGabonGambia, TheGeorgiaGermanyGhanaGibraltarGreeceGreenlandGrenadaGuamGuatemalaGuineaGuinea-BissauGuyanaHaitiHeavily indebted poor countries (HIPC)High incomeHondurasHong Kong SAR, ChinaHungaryIBRD onlyIcelandIDA & IBRD totalIDA blendIDA onlyIDA totalIndiaIndonesiaIran, Islamic Rep.IraqIrelandIsraelItalyJamaicaJapanJordanKazakhstanKenyaKiribatiKorea, Dem. People’s Rep.Korea, Rep.KosovoKuwaitKyrgyz RepublicLao PDRLate-demographic dividendLatin America & Caribbean Latin America & Caribbean (excluding high income)Latin America & the Caribbean (IDA & IBRD countries)LatviaLeast developed countries: UN classificationLebanonLiberiaLibyaLithuaniaLow & middle incomeLow incomeLower middle incomeLuxembourgMacao SAR, ChinaMacedonia, FYRMadagascarMalawiMalaysiaMaldivesMaliMaltaMauritaniaMauritiusMexicoMiddle East & North AfricaMiddle East & North Africa (excluding high income)Middle East & North Africa (IDA & IBRD countries)Middle incomeMoldovaMongoliaMontenegroMoroccoMozambiqueMyanmarNauruNepalNetherlandsNew CaledoniaNew ZealandNicaraguaNigerNigeriaNorth AmericaNorwayOECD membersOmanOther small statesPacific island small statesPakistanPanamaPapua New GuineaParaguayPeruPhilippinesPolandPortugalPost-demographic dividendPre-demographic dividendQatarRomaniaRussian FederationRwandaSamoaSao Tome and PrincipeSaudi ArabiaSenegalSerbiaSeychellesSierra LeoneSingaporeSlovak RepublicSloveniaSmall statesSolomon IslandsSomaliaSouth AfricaSouth AsiaSouth Asia (IDA & IBRD)SpainSri LankaSt. Kitts and NevisSt. LuciaSt. Vincent and the GrenadinesSub-Saharan Africa Sub-Saharan Africa (excluding high income)Sub-Saharan Africa (IDA & IBRD countries)SudanSurinameSwedenSwitzerlandSyrian Arab RepublicTajikistanTanzaniaThailandTogoTongaTrinidad and TobagoTunisiaTurkeyTurkmenistanTuvaluUgandaUkraineUnited Arab EmiratesUnited KingdomUnited StatesUpper middle incomeUruguayUzbekistanVanuatuVenezuela, RBVietnamWorldYemen, Rep.ZambiaZimbabwe Timeline:
This timeline shows a graph from 1961 to 2015 of Fiji. No data until 1960. Number of actual observations by date: 55.
Source name:
World Development Indicators
Source organization:
World Bank staff estimates based data from International Monetary Fund's Direction of Trade database.
Categories, topics:
Private Sector, Trade
Last updated:
apr 23, 2017
Indicators value changes by year
Maximum:
29.934
jan 1, 1987
At the date of observation
Value
Absolute change
Change from previous value
jan 1, 1961
9.367
+9.367
0.0%
jan 1, 1962
0.0
-9.367
-100.0%
jan 1, 1963
14.61
+14.61
%
jan 1, 1964
9.009
-5.601
-38.33%
jan 1, 1965
10.652
+1.643
18.24%
jan 1, 1966
14.657
+4.005
37.6%
jan 1, 1967
14.959
+0.302
2.06%
jan 1, 1968
8.537
-6.422
-42.93%
jan 1, 1969
8.249
-0.287
-3.36%
jan 1, 1970
10.553
+2.304
27.93%
jan 1, 1971
11.53
+0.977
9.25%
jan 1, 1972
11.867
+0.337
2.93%
jan 1, 1973
10.559
-1.309
-11.03%
jan 1, 1974
10.825
+0.266
2.52%
jan 1, 1975
11.812
+0.987
9.12%
jan 1, 1976
10.24
-1.572
-13.31%
jan 1, 1977
6.577
-3.663
-35.77%
jan 1, 1978
10.263
+3.685
56.03%
jan 1, 1979
9.539
-0.723
-7.05%
jan 1, 1980
11.436
+1.897
19.88%
jan 1, 1981
12.194
+0.758
6.62%
jan 1, 1982
14.897
+2.703
22.17%
jan 1, 1983
15.623
+0.726
4.87%
jan 1, 1984
13.335
-2.288
-14.64%
jan 1, 1985
15.132
+1.797
13.47%
jan 1, 1986
16.779
+1.647
10.89%
jan 1, 1987
29.934
+13.155
78.4%
jan 1, 1988
8.443
-21.491
-71.8%
jan 1, 1989
7.68
-0.763
-9.04%
jan 1, 1990
8.182
+0.502
6.54%
jan 1, 1991
25.477
+17.295
211.38%
jan 1, 1992
24.064
-1.412
-5.54%
jan 1, 1993
8.268
-15.797
-65.64%
jan 1, 1994
17.378
+9.11
110.19%
jan 1, 1995
16.278
-1.1
-6.33%
jan 1, 1996
7.047
-9.231
-56.71%
jan 1, 1997
6.982
-0.065
-0.93%
jan 1, 1998
9.052
+2.07
29.65%
jan 1, 1999
9.83
+0.778
8.6%
jan 1, 2000
9.396
-0.434
-4.41%
jan 1, 2001
11.303
+1.907
20.29%
jan 1, 2002
13.43
+2.127
18.82%
jan 1, 2003
15.099
+1.669
12.43%
jan 1, 2004
15.726
+0.627
4.15%
jan 1, 2005
16.804
+1.078
6.85%
jan 1, 2006
19.408
+2.603
15.49%
jan 1, 2007
21.817
+2.41
12.42%
jan 1, 2008
24.839
+3.022
13.85%
jan 1, 2009
25.077
+0.238
0.96%
jan 1, 2010
25.174
+0.096
0.38%
jan 1, 2011
26.117
+0.943
3.75%
jan 1, 2012
27.403
+1.287
4.93%
jan 1, 2013
27.419
+0.016
0.06%
jan 1, 2014
28.306
+0.886
3.23%
jan 1, 2015
28.726
+0.42
1.48%
Ranking of countries by current statistics by years


Comments: