29
/
en
AIzaSyAYiBZKx7MnpbEhh9jyipgxe19OcubqV5w
April 1, 2024
33626
European Union
EUU
false
2
1
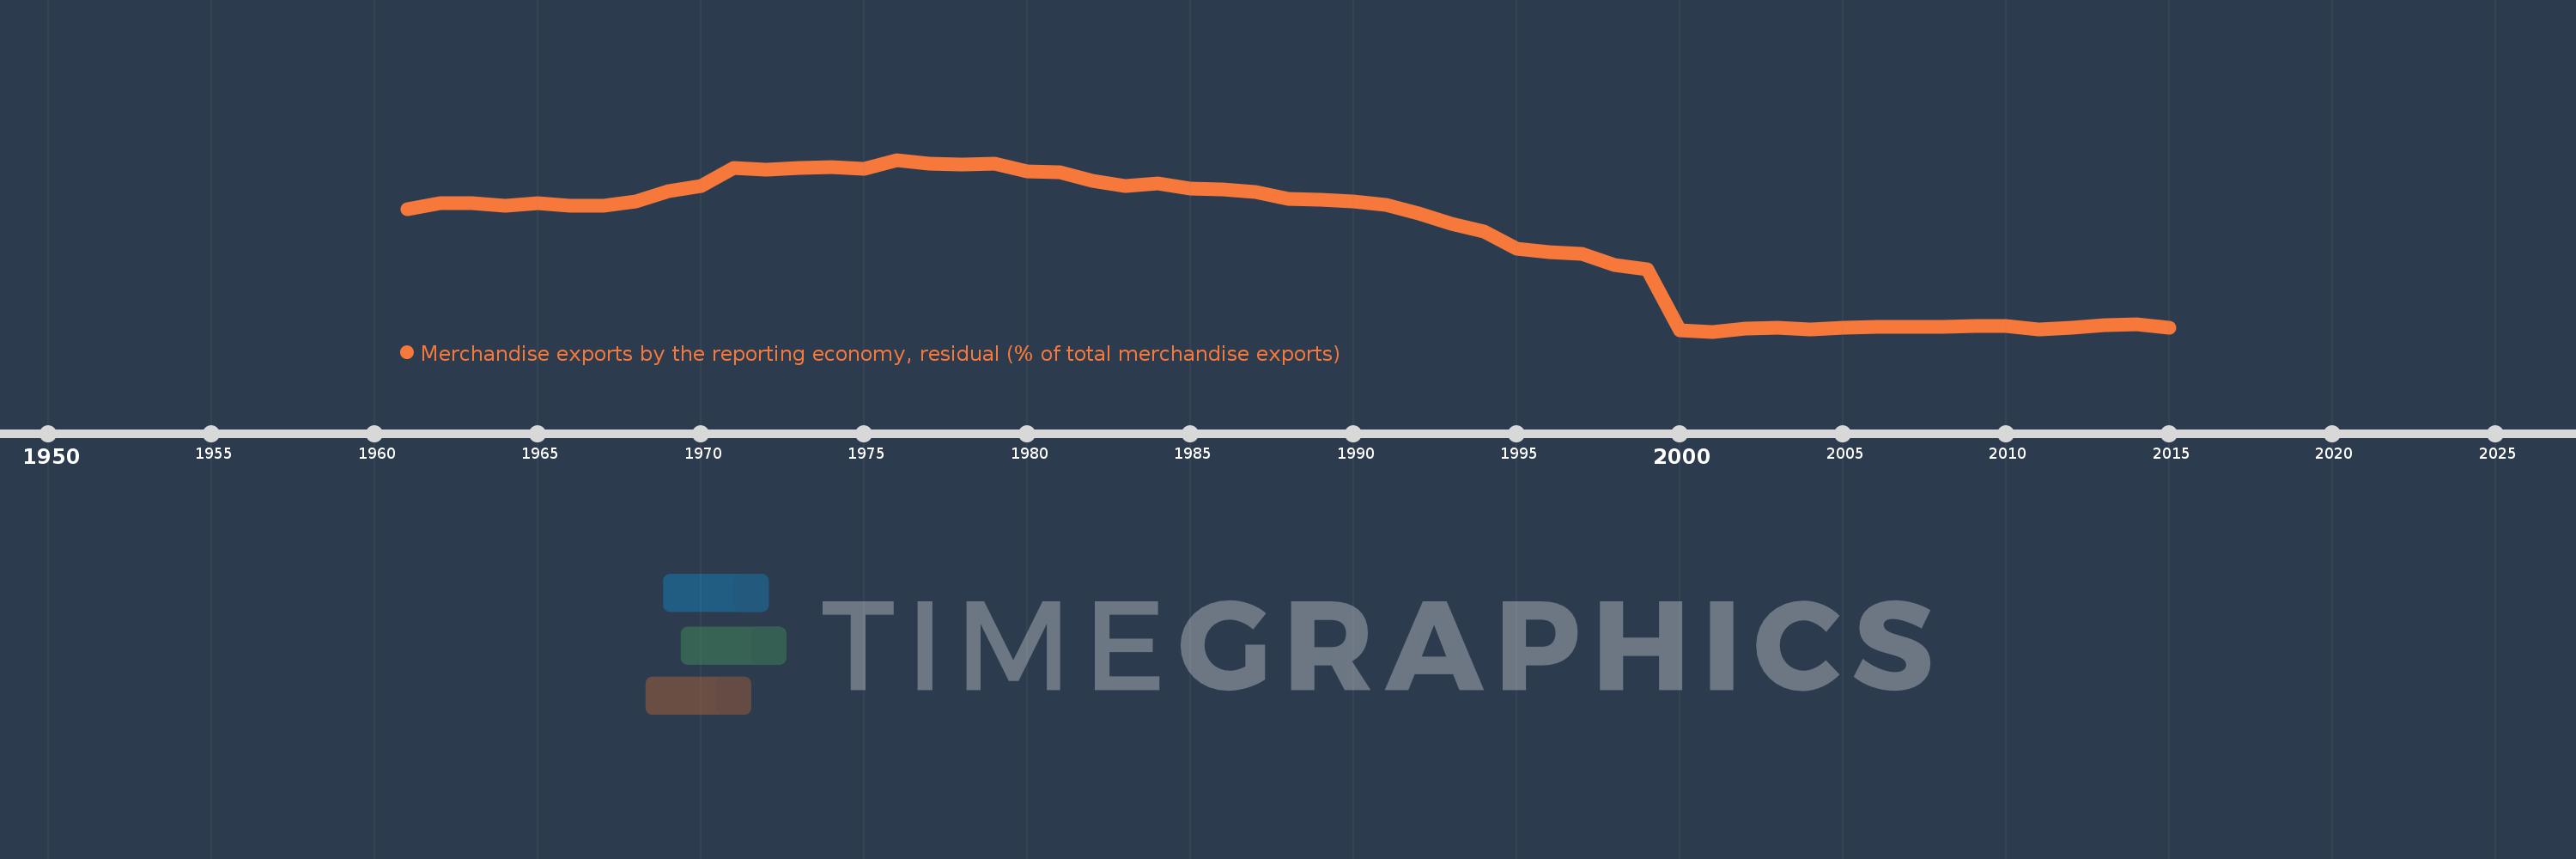
Merchandise exports by the reporting economy, residual (% of total merchandise exports)
2015,2014,2013,2012,2011,2010,2009,2008,2007,2006,2005,2004,2003,2002,2001,2000,1999,1998,1997,1996,1995,1994,1993,1992,1991,1990,1989,1988,1987,1986,1985,1984,1983,1982,1981,1980,1979,1978,1977,1976,1975,1974,1973,1972,1971,1970,1969,1968,1967,1966,1965,1964,1963,1962,1961
This statistics in other country:
AfghanistanAlbaniaAlgeriaAmerican SamoaAngolaAntigua and BarbudaArab WorldArgentinaArmeniaArubaAustraliaAustriaAzerbaijanBahamas, TheBahrainBangladeshBarbadosBelarusBelgiumBelizeBeninBermudaBoliviaBosnia and HerzegovinaBrazilBrunei DarussalamBulgariaBurkina FasoBurundiCabo VerdeCambodiaCameroonCanadaCaribbean small statesCentral African RepublicCentral Europe and the BalticsChadChileChinaColombiaComorosCongo, Dem. Rep.Congo, Rep.Costa RicaCote d'IvoireCroatiaCubaCyprusCzech RepublicDenmarkDjiboutiDominicaDominican RepublicEarly-demographic dividendEast Asia & PacificEast Asia & Pacific (excluding high income)East Asia & Pacific (IDA & IBRD countries)EcuadorEgypt, Arab Rep.El SalvadorEquatorial GuineaEstoniaEthiopiaEuro areaEurope & Central AsiaEurope & Central Asia (excluding high income)Europe & Central Asia (IDA & IBRD countries)European UnionFaroe IslandsFijiFinlandFragile and conflict affected situationsFranceFrench PolynesiaGabonGambia, TheGeorgiaGermanyGhanaGibraltarGreeceGreenlandGrenadaGuamGuatemalaGuineaGuinea-BissauGuyanaHaitiHeavily indebted poor countries (HIPC)High incomeHondurasHong Kong SAR, ChinaHungaryIBRD onlyIcelandIDA & IBRD totalIDA blendIDA onlyIDA totalIndiaIndonesiaIran, Islamic Rep.IraqIrelandIsraelItalyJamaicaJapanJordanKazakhstanKenyaKiribatiKorea, Dem. People’s Rep.Korea, Rep.KosovoKuwaitKyrgyz RepublicLao PDRLate-demographic dividendLatin America & Caribbean Latin America & Caribbean (excluding high income)Latin America & the Caribbean (IDA & IBRD countries)LatviaLeast developed countries: UN classificationLebanonLiberiaLibyaLithuaniaLow & middle incomeLow incomeLower middle incomeLuxembourgMacao SAR, ChinaMacedonia, FYRMadagascarMalawiMalaysiaMaldivesMaliMaltaMauritaniaMauritiusMexicoMiddle East & North AfricaMiddle East & North Africa (excluding high income)Middle East & North Africa (IDA & IBRD countries)Middle incomeMoldovaMongoliaMontenegroMoroccoMozambiqueMyanmarNauruNepalNetherlandsNew CaledoniaNew ZealandNicaraguaNigerNigeriaNorth AmericaNorwayOECD membersOmanOther small statesPacific island small statesPakistanPanamaPapua New GuineaParaguayPeruPhilippinesPolandPortugalPost-demographic dividendPre-demographic dividendQatarRomaniaRussian FederationRwandaSamoaSao Tome and PrincipeSaudi ArabiaSenegalSerbiaSeychellesSierra LeoneSingaporeSlovak RepublicSloveniaSmall statesSolomon IslandsSomaliaSouth AfricaSouth AsiaSouth Asia (IDA & IBRD)SpainSri LankaSt. Kitts and NevisSt. LuciaSt. Vincent and the GrenadinesSub-Saharan Africa Sub-Saharan Africa (excluding high income)Sub-Saharan Africa (IDA & IBRD countries)SudanSurinameSwedenSwitzerlandSyrian Arab RepublicTajikistanTanzaniaThailandTogoTongaTrinidad and TobagoTunisiaTurkeyTurkmenistanTuvaluUgandaUkraineUnited Arab EmiratesUnited KingdomUnited StatesUpper middle incomeUruguayUzbekistanVanuatuVenezuela, RBVietnamWorldYemen, Rep.ZambiaZimbabwe Timeline:
This timeline shows a graph from 1961 to 2015 of European Union. No data until 1960. Number of actual observations by date: 55.
Source name:
World Development Indicators
Source organization:
World Bank staff estimates based data from International Monetary Fund's Direction of Trade database.
Categories, topics:
Private Sector, Trade
Last updated:
apr 23, 2017
Indicators value changes by year
Maximum:
15.191
jan 1, 1976
At the date of observation
Value
Absolute change
Change from previous value
jan 1, 1961
11.116
+11.116
0.0%
jan 1, 1962
11.606
+0.49
4.41%
jan 1, 1963
11.597
-0.01
-0.08%
jan 1, 1964
11.333
-0.263
-2.27%
jan 1, 1965
11.548
+0.214
1.89%
jan 1, 1966
11.335
-0.213
-1.84%
jan 1, 1967
11.402
+0.068
0.6%
jan 1, 1968
11.709
+0.307
2.69%
jan 1, 1969
12.557
+0.848
7.24%
jan 1, 1970
13.026
+0.469
3.74%
jan 1, 1971
14.518
+1.491
11.45%
jan 1, 1972
14.355
-0.163
-1.12%
jan 1, 1973
14.528
+0.173
1.21%
jan 1, 1974
14.557
+0.029
0.2%
jan 1, 1975
14.435
-0.122
-0.84%
jan 1, 1976
15.191
+0.756
5.24%
jan 1, 1977
14.837
-0.354
-2.33%
jan 1, 1978
14.831
-0.006
-0.04%
jan 1, 1979
14.867
+0.037
0.25%
jan 1, 1980
14.248
-0.62
-4.17%
jan 1, 1981
14.124
-0.123
-0.86%
jan 1, 1982
13.424
-0.7
-4.96%
jan 1, 1983
12.994
-0.43
-3.2%
jan 1, 1984
13.261
+0.267
2.06%
jan 1, 1985
12.81
-0.452
-3.41%
jan 1, 1986
12.707
-0.102
-0.8%
jan 1, 1987
12.509
-0.198
-1.56%
jan 1, 1988
11.931
-0.578
-4.62%
jan 1, 1989
11.877
-0.054
-0.45%
jan 1, 1990
11.726
-0.151
-1.27%
jan 1, 1991
11.471
-0.255
-2.17%
jan 1, 1992
10.696
-0.775
-6.76%
jan 1, 1993
9.864
-0.832
-7.78%
jan 1, 1994
9.242
-0.622
-6.31%
jan 1, 1995
7.816
-1.425
-15.42%
jan 1, 1996
7.502
-0.315
-4.03%
jan 1, 1997
7.333
-0.168
-2.24%
jan 1, 1998
6.447
-0.887
-12.09%
jan 1, 1999
6.065
-0.382
-5.92%
jan 1, 2000
1.0
-5.065
-83.52%
jan 1, 2001
0.899
-0.1
-10.05%
jan 1, 2002
1.166
+0.267
29.69%
jan 1, 2003
1.232
+0.066
5.65%
jan 1, 2004
1.048
-0.184
-14.91%
jan 1, 2005
1.196
+0.148
14.07%
jan 1, 2006
1.259
+0.063
5.24%
jan 1, 2007
1.287
+0.028
2.25%
jan 1, 2008
1.281
-0.006
-0.5%
jan 1, 2009
1.349
+0.068
5.31%
jan 1, 2010
1.331
-0.017
-1.3%
jan 1, 2011
1.093
-0.238
-17.88%
jan 1, 2012
1.216
+0.123
11.21%
jan 1, 2013
1.406
+0.19
15.63%
jan 1, 2014
1.482
+0.077
5.46%
jan 1, 2015
1.254
-0.229
-15.44%
Ranking of countries by current statistics by years


Comments: