29
/
en
AIzaSyAYiBZKx7MnpbEhh9jyipgxe19OcubqV5w
April 1, 2024
185455
Madagascar
MDG
true
2
1
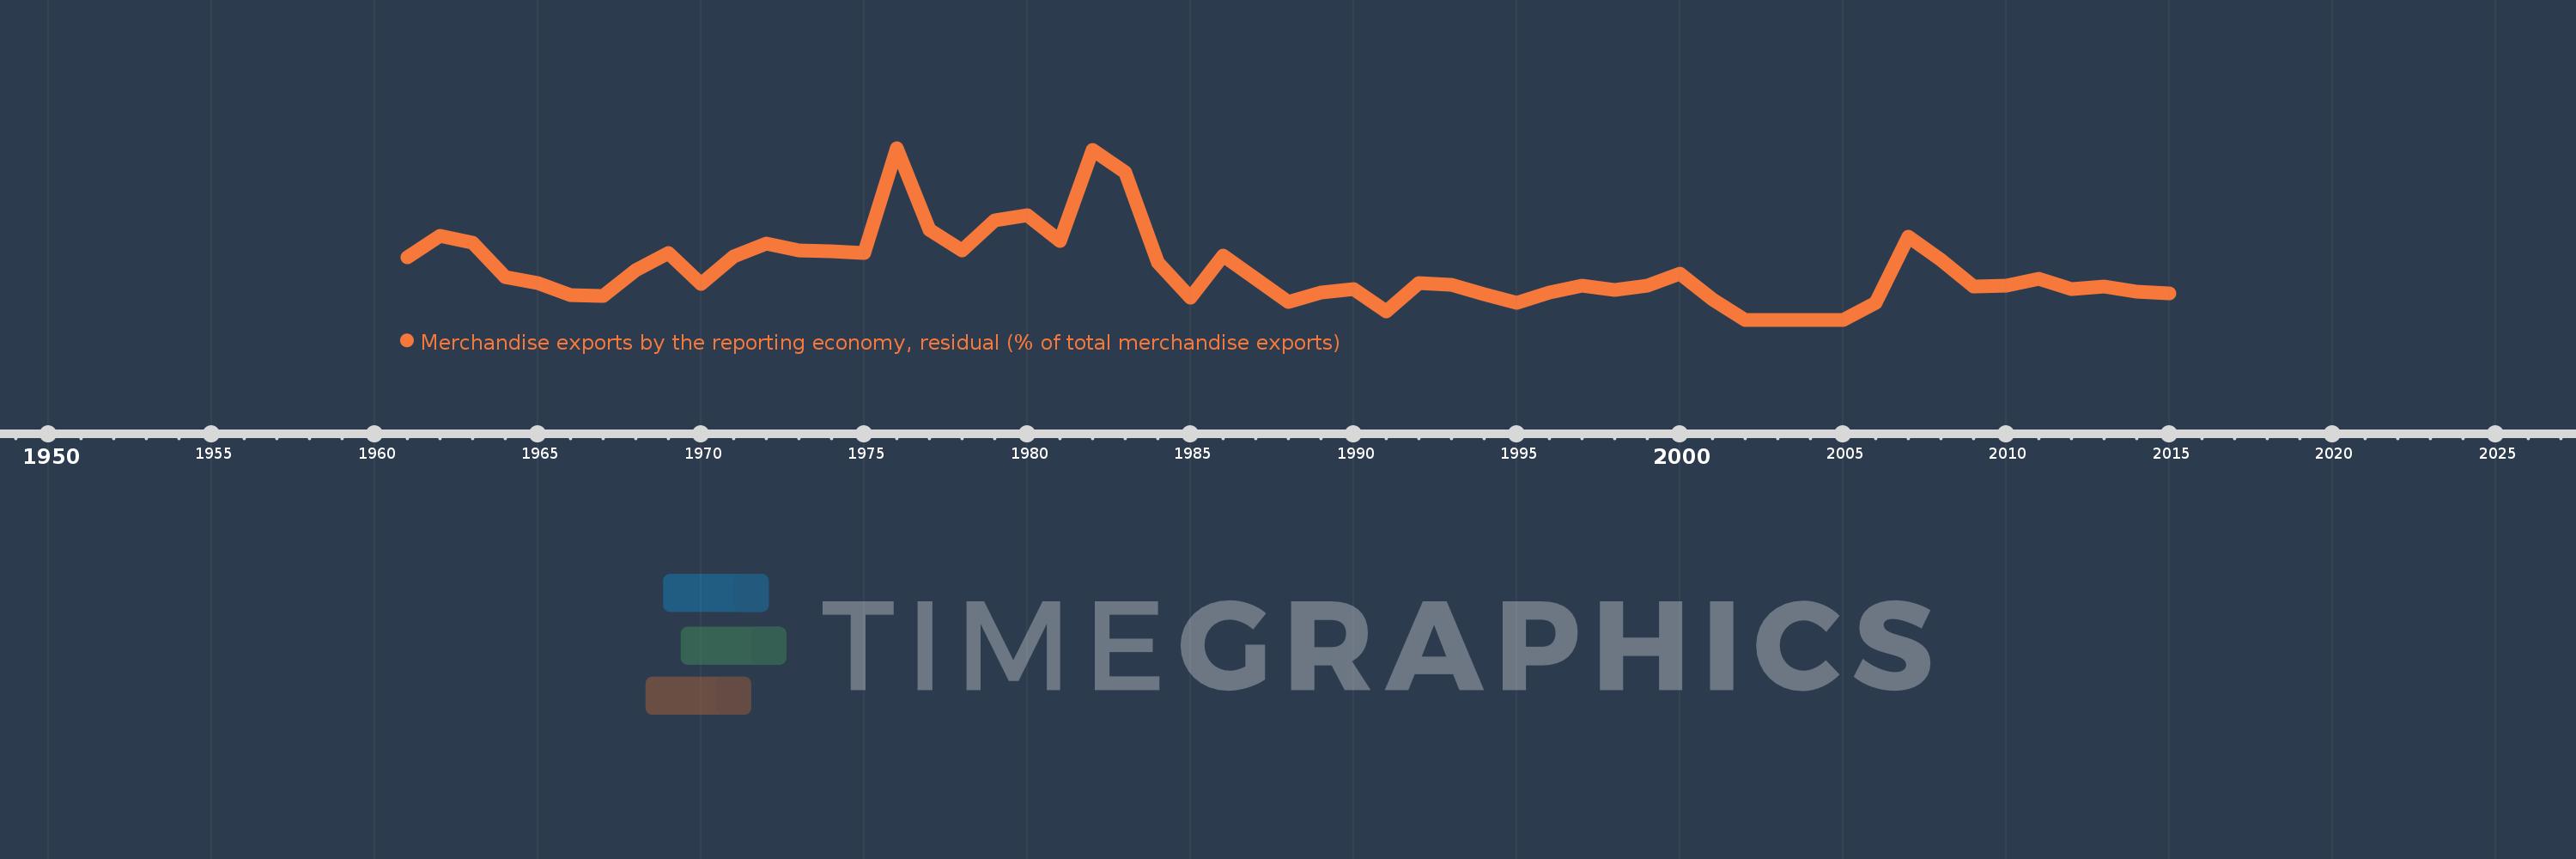
Merchandise exports by the reporting economy, residual (% of total merchandise exports)
2015,2014,2013,2012,2011,2010,2009,2008,2007,2006,2005,2004,2003,2002,2001,2000,1999,1998,1997,1996,1995,1994,1993,1992,1991,1990,1989,1988,1987,1986,1985,1984,1983,1982,1981,1980,1979,1978,1977,1976,1975,1974,1973,1972,1971,1970,1969,1968,1967,1966,1965,1964,1963,1962,1961
This statistics in other country:
AfghanistanAlbaniaAlgeriaAmerican SamoaAngolaAntigua and BarbudaArab WorldArgentinaArmeniaArubaAustraliaAustriaAzerbaijanBahamas, TheBahrainBangladeshBarbadosBelarusBelgiumBelizeBeninBermudaBoliviaBosnia and HerzegovinaBrazilBrunei DarussalamBulgariaBurkina FasoBurundiCabo VerdeCambodiaCameroonCanadaCaribbean small statesCentral African RepublicCentral Europe and the BalticsChadChileChinaColombiaComorosCongo, Dem. Rep.Congo, Rep.Costa RicaCote d'IvoireCroatiaCubaCyprusCzech RepublicDenmarkDjiboutiDominicaDominican RepublicEarly-demographic dividendEast Asia & PacificEast Asia & Pacific (excluding high income)East Asia & Pacific (IDA & IBRD countries)EcuadorEgypt, Arab Rep.El SalvadorEquatorial GuineaEstoniaEthiopiaEuro areaEurope & Central AsiaEurope & Central Asia (excluding high income)Europe & Central Asia (IDA & IBRD countries)European UnionFaroe IslandsFijiFinlandFragile and conflict affected situationsFranceFrench PolynesiaGabonGambia, TheGeorgiaGermanyGhanaGibraltarGreeceGreenlandGrenadaGuamGuatemalaGuineaGuinea-BissauGuyanaHaitiHeavily indebted poor countries (HIPC)High incomeHondurasHong Kong SAR, ChinaHungaryIBRD onlyIcelandIDA & IBRD totalIDA blendIDA onlyIDA totalIndiaIndonesiaIran, Islamic Rep.IraqIrelandIsraelItalyJamaicaJapanJordanKazakhstanKenyaKiribatiKorea, Dem. People’s Rep.Korea, Rep.KosovoKuwaitKyrgyz RepublicLao PDRLate-demographic dividendLatin America & Caribbean Latin America & Caribbean (excluding high income)Latin America & the Caribbean (IDA & IBRD countries)LatviaLeast developed countries: UN classificationLebanonLiberiaLibyaLithuaniaLow & middle incomeLow incomeLower middle incomeLuxembourgMacao SAR, ChinaMacedonia, FYRMadagascarMalawiMalaysiaMaldivesMaliMaltaMauritaniaMauritiusMexicoMiddle East & North AfricaMiddle East & North Africa (excluding high income)Middle East & North Africa (IDA & IBRD countries)Middle incomeMoldovaMongoliaMontenegroMoroccoMozambiqueMyanmarNauruNepalNetherlandsNew CaledoniaNew ZealandNicaraguaNigerNigeriaNorth AmericaNorwayOECD membersOmanOther small statesPacific island small statesPakistanPanamaPapua New GuineaParaguayPeruPhilippinesPolandPortugalPost-demographic dividendPre-demographic dividendQatarRomaniaRussian FederationRwandaSamoaSao Tome and PrincipeSaudi ArabiaSenegalSerbiaSeychellesSierra LeoneSingaporeSlovak RepublicSloveniaSmall statesSolomon IslandsSomaliaSouth AfricaSouth AsiaSouth Asia (IDA & IBRD)SpainSri LankaSt. Kitts and NevisSt. LuciaSt. Vincent and the GrenadinesSub-Saharan Africa Sub-Saharan Africa (excluding high income)Sub-Saharan Africa (IDA & IBRD countries)SudanSurinameSwedenSwitzerlandSyrian Arab RepublicTajikistanTanzaniaThailandTogoTongaTrinidad and TobagoTunisiaTurkeyTurkmenistanTuvaluUgandaUkraineUnited Arab EmiratesUnited KingdomUnited StatesUpper middle incomeUruguayUzbekistanVanuatuVenezuela, RBVietnamWorldYemen, Rep.ZambiaZimbabwe Timeline:
This timeline shows a graph from 1961 to 2015 of Madagascar. No data until 1960. Number of actual observations by date: 55.
Source name:
World Development Indicators
Source organization:
World Bank staff estimates based data from International Monetary Fund's Direction of Trade database.
Categories, topics:
Private Sector, Trade
Last updated:
apr 23, 2017
Indicators value changes by year
At the date of observation
Value
Absolute change
Change from previous value
jan 1, 1961
15.049
+15.049
0.0%
jan 1, 1962
20.19
+5.14
34.16%
jan 1, 1963
18.568
-1.621
-8.03%
jan 1, 1964
10.323
-8.246
-44.41%
jan 1, 1965
8.891
-1.431
-13.86%
jan 1, 1966
5.923
-2.968
-33.38%
jan 1, 1967
5.717
-0.206
-3.48%
jan 1, 1968
11.91
+6.192
108.31%
jan 1, 1969
16.078
+4.169
35.0%
jan 1, 1970
8.605
-7.473
-46.48%
jan 1, 1971
15.322
+6.716
78.05%
jan 1, 1972
18.325
+3.003
19.6%
jan 1, 1973
16.754
-1.571
-8.57%
jan 1, 1974
16.474
-0.28
-1.67%
jan 1, 1975
16.113
-0.361
-2.19%
jan 1, 1976
41.28
+25.167
156.19%
jan 1, 1977
21.655
-19.625
-47.54%
jan 1, 1978
16.697
-4.958
-22.9%
jan 1, 1979
23.852
+7.155
42.85%
jan 1, 1980
25.114
+1.262
5.29%
jan 1, 1981
19.026
-6.088
-24.24%
jan 1, 1982
40.838
+21.812
114.65%
jan 1, 1983
35.358
-5.481
-13.42%
jan 1, 1984
13.732
-21.625
-61.16%
jan 1, 1985
5.28
-8.452
-61.55%
jan 1, 1986
15.479
+10.199
193.16%
jan 1, 1987
9.982
-5.497
-35.51%
jan 1, 1988
4.312
-5.67
-56.8%
jan 1, 1989
6.652
+2.34
54.26%
jan 1, 1990
7.508
+0.857
12.88%
jan 1, 1991
2.081
-5.427
-72.28%
jan 1, 1992
8.767
+6.686
321.24%
jan 1, 1993
8.497
-0.27
-3.08%
jan 1, 1994
6.266
-2.231
-26.26%
jan 1, 1995
4.15
-2.116
-33.77%
jan 1, 1996
6.524
+2.374
57.22%
jan 1, 1997
8.247
+1.722
26.4%
jan 1, 1998
7.25
-0.997
-12.09%
jan 1, 1999
8.305
+1.056
14.56%
jan 1, 2000
11.186
+2.881
34.68%
jan 1, 2001
4.963
-6.223
-55.63%
jan 1, 2002
0.074
-4.889
-98.52%
jan 1, 2003
0.074
+0.001
0.71%
jan 1, 2004
0.091
+0.017
23.39%
jan 1, 2005
0.055
-0.036
-39.74%
jan 1, 2006
4.102
+4.047
7.34K%
jan 1, 2007
20.027
+15.926
388.25%
jan 1, 2008
14.372
-5.655
-28.24%
jan 1, 2009
7.99
-6.383
-44.41%
jan 1, 2010
8.186
+0.197
2.46%
jan 1, 2011
9.911
+1.724
21.06%
jan 1, 2012
7.438
-2.473
-24.95%
jan 1, 2013
8.123
+0.685
9.21%
jan 1, 2014
6.88
-1.242
-15.29%
jan 1, 2015
6.353
-0.528
-7.67%
Ranking of countries by current statistics by years


Comments: