29
/
en
AIzaSyAYiBZKx7MnpbEhh9jyipgxe19OcubqV5w
April 1, 2024
63724
Afghanistan
AFG
true
2
1
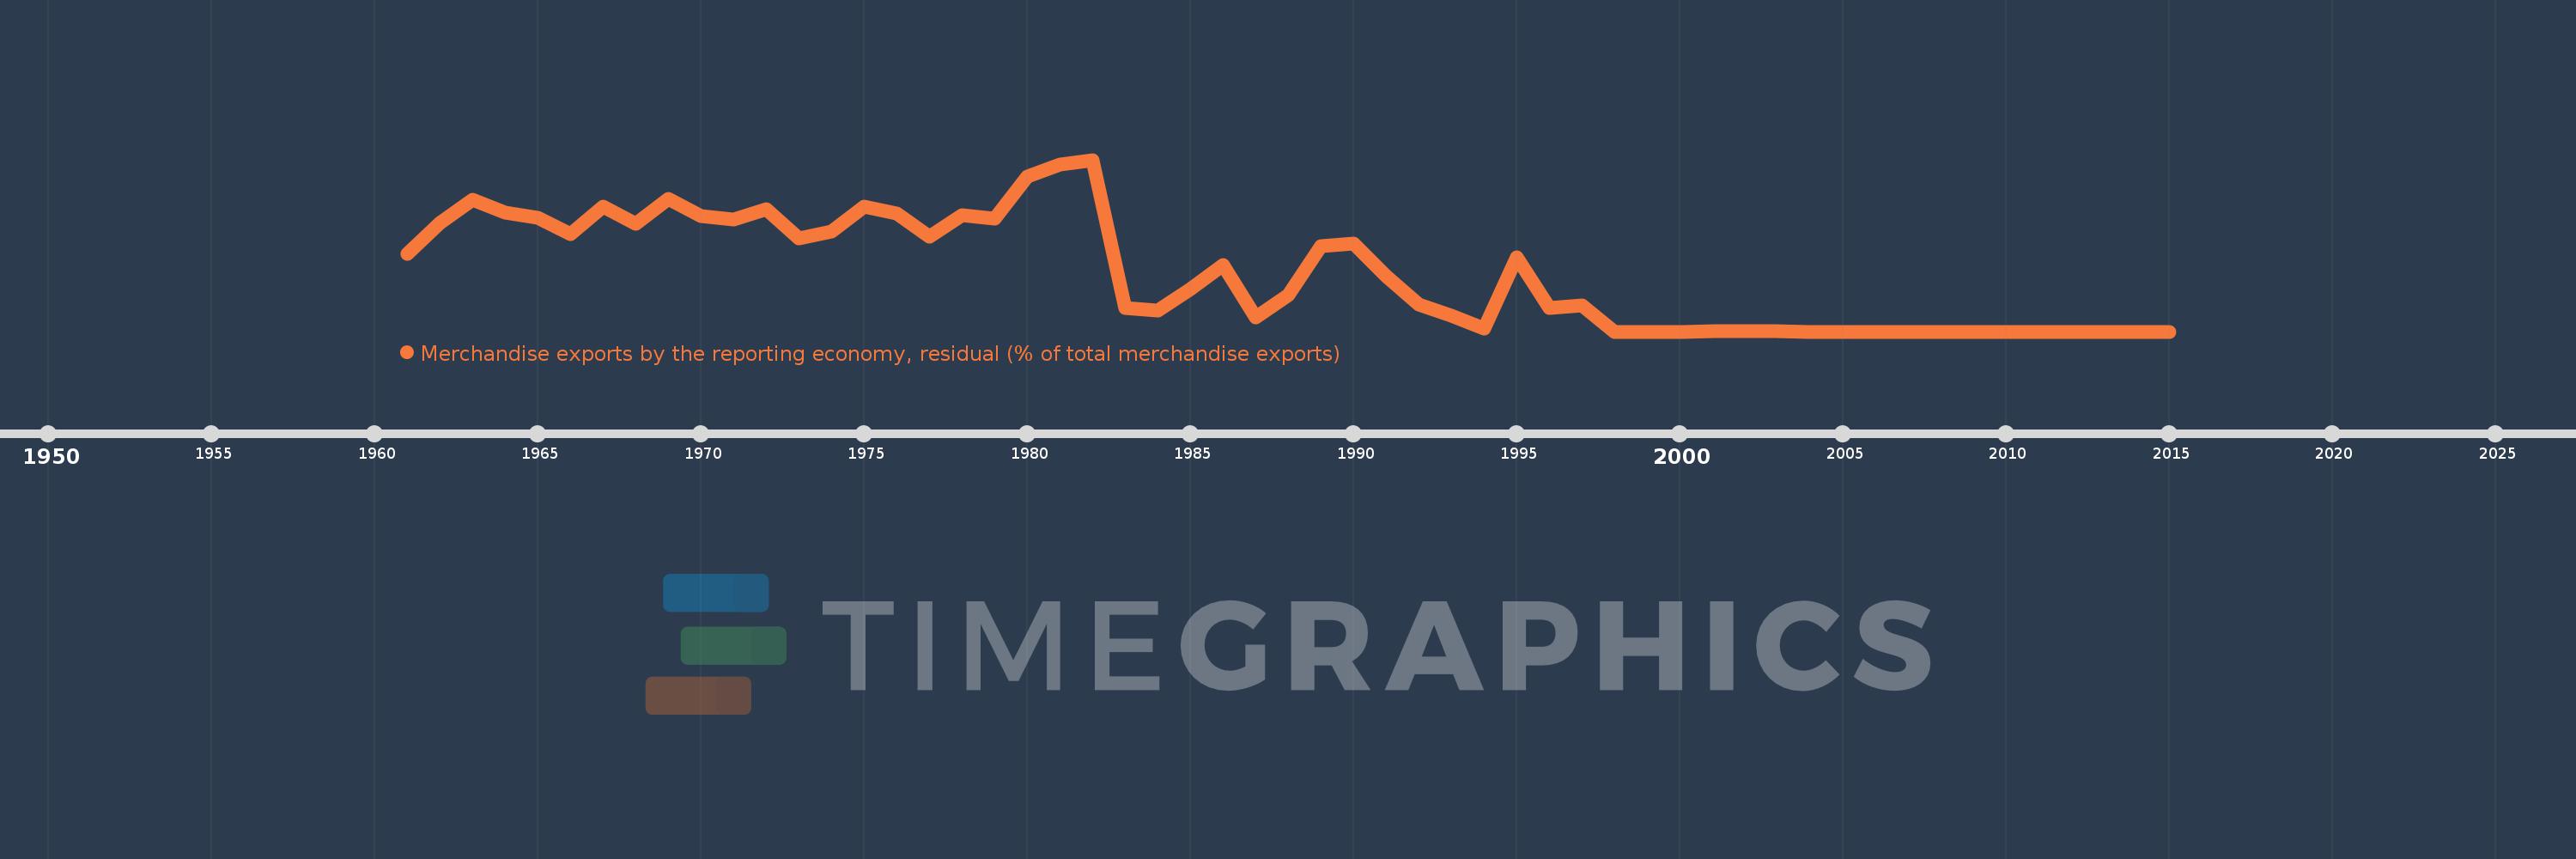
Merchandise exports by the reporting economy, residual (% of total merchandise exports)
2015,2014,2013,2012,2011,2010,2009,2008,2007,2006,2005,2004,2003,2002,2001,2000,1999,1998,1997,1996,1995,1994,1993,1992,1991,1990,1989,1988,1987,1986,1985,1984,1983,1982,1981,1980,1979,1978,1977,1976,1975,1974,1973,1972,1971,1970,1969,1968,1967,1966,1965,1964,1963,1962,1961
This statistics in other country:
AfghanistanAlbaniaAlgeriaAmerican SamoaAngolaAntigua and BarbudaArab WorldArgentinaArmeniaArubaAustraliaAustriaAzerbaijanBahamas, TheBahrainBangladeshBarbadosBelarusBelgiumBelizeBeninBermudaBoliviaBosnia and HerzegovinaBrazilBrunei DarussalamBulgariaBurkina FasoBurundiCabo VerdeCambodiaCameroonCanadaCaribbean small statesCentral African RepublicCentral Europe and the BalticsChadChileChinaColombiaComorosCongo, Dem. Rep.Congo, Rep.Costa RicaCote d'IvoireCroatiaCubaCyprusCzech RepublicDenmarkDjiboutiDominicaDominican RepublicEarly-demographic dividendEast Asia & PacificEast Asia & Pacific (excluding high income)East Asia & Pacific (IDA & IBRD countries)EcuadorEgypt, Arab Rep.El SalvadorEquatorial GuineaEstoniaEthiopiaEuro areaEurope & Central AsiaEurope & Central Asia (excluding high income)Europe & Central Asia (IDA & IBRD countries)European UnionFaroe IslandsFijiFinlandFragile and conflict affected situationsFranceFrench PolynesiaGabonGambia, TheGeorgiaGermanyGhanaGibraltarGreeceGreenlandGrenadaGuamGuatemalaGuineaGuinea-BissauGuyanaHaitiHeavily indebted poor countries (HIPC)High incomeHondurasHong Kong SAR, ChinaHungaryIBRD onlyIcelandIDA & IBRD totalIDA blendIDA onlyIDA totalIndiaIndonesiaIran, Islamic Rep.IraqIrelandIsraelItalyJamaicaJapanJordanKazakhstanKenyaKiribatiKorea, Dem. People’s Rep.Korea, Rep.KosovoKuwaitKyrgyz RepublicLao PDRLate-demographic dividendLatin America & Caribbean Latin America & Caribbean (excluding high income)Latin America & the Caribbean (IDA & IBRD countries)LatviaLeast developed countries: UN classificationLebanonLiberiaLibyaLithuaniaLow & middle incomeLow incomeLower middle incomeLuxembourgMacao SAR, ChinaMacedonia, FYRMadagascarMalawiMalaysiaMaldivesMaliMaltaMauritaniaMauritiusMexicoMiddle East & North AfricaMiddle East & North Africa (excluding high income)Middle East & North Africa (IDA & IBRD countries)Middle incomeMoldovaMongoliaMontenegroMoroccoMozambiqueMyanmarNauruNepalNetherlandsNew CaledoniaNew ZealandNicaraguaNigerNigeriaNorth AmericaNorwayOECD membersOmanOther small statesPacific island small statesPakistanPanamaPapua New GuineaParaguayPeruPhilippinesPolandPortugalPost-demographic dividendPre-demographic dividendQatarRomaniaRussian FederationRwandaSamoaSao Tome and PrincipeSaudi ArabiaSenegalSerbiaSeychellesSierra LeoneSingaporeSlovak RepublicSloveniaSmall statesSolomon IslandsSomaliaSouth AfricaSouth AsiaSouth Asia (IDA & IBRD)SpainSri LankaSt. Kitts and NevisSt. LuciaSt. Vincent and the GrenadinesSub-Saharan Africa Sub-Saharan Africa (excluding high income)Sub-Saharan Africa (IDA & IBRD countries)SudanSurinameSwedenSwitzerlandSyrian Arab RepublicTajikistanTanzaniaThailandTogoTongaTrinidad and TobagoTunisiaTurkeyTurkmenistanTuvaluUgandaUkraineUnited Arab EmiratesUnited KingdomUnited StatesUpper middle incomeUruguayUzbekistanVanuatuVenezuela, RBVietnamWorldYemen, Rep.ZambiaZimbabwe Timeline:
This timeline shows a graph from 1961 to 2015 of Afghanistan. No data until 1960. Number of actual observations by date: 55.
Source name:
World Development Indicators
Source organization:
World Bank staff estimates based data from International Monetary Fund's Direction of Trade database.
Categories, topics:
Private Sector, Trade
Last updated:
apr 23, 2017
Indicators value changes by year
Maximum:
66.586
jan 1, 1982
At the date of observation
Value
Absolute change
Change from previous value
jan 1, 1961
30.261
+30.261
0.0%
jan 1, 1962
42.135
+11.874
39.24%
jan 1, 1963
51.104
+8.969
21.29%
jan 1, 1964
46.077
-5.027
-9.84%
jan 1, 1965
44.253
-1.824
-3.96%
jan 1, 1966
37.698
-6.555
-14.81%
jan 1, 1967
48.324
+10.626
28.19%
jan 1, 1968
41.749
-6.575
-13.61%
jan 1, 1969
51.324
+9.575
22.93%
jan 1, 1970
44.85
-6.473
-12.61%
jan 1, 1971
43.285
-1.565
-3.49%
jan 1, 1972
47.314
+4.03
9.31%
jan 1, 1973
36.023
-11.291
-23.86%
jan 1, 1974
38.844
+2.82
7.83%
jan 1, 1975
48.329
+9.485
24.42%
jan 1, 1976
45.732
-2.597
-5.37%
jan 1, 1977
36.88
-8.852
-19.36%
jan 1, 1978
45.115
+8.236
22.33%
jan 1, 1979
43.718
-1.397
-3.1%
jan 1, 1980
60.017
+16.298
37.28%
jan 1, 1981
64.592
+4.576
7.62%
jan 1, 1982
66.586
+1.994
3.09%
jan 1, 1983
9.286
-57.3
-86.05%
jan 1, 1984
8.235
-1.051
-11.32%
jan 1, 1985
16.495
+8.261
100.32%
jan 1, 1986
25.96
+9.464
57.37%
jan 1, 1987
5.438
-20.522
-79.05%
jan 1, 1988
14.244
+8.806
161.95%
jan 1, 1989
33.029
+18.785
131.88%
jan 1, 1990
34.036
+1.007
3.05%
jan 1, 1991
21.469
-12.566
-36.92%
jan 1, 1992
10.638
-10.831
-50.45%
jan 1, 1993
6.228
-4.41
-41.46%
jan 1, 1994
1.066
-5.161
-82.88%
jan 1, 1995
28.879
+27.813
2.61K%
jan 1, 1996
9.235
-19.644
-68.02%
jan 1, 1997
10.253
+1.018
11.03%
jan 1, 1998
0.0
-10.253
-100.0%
jan 1, 1999
0.0
0.0
-195.54%
jan 1, 2000
0.0
+0.0
-100.0%
jan 1, 2001
0.032
+0.032
%
jan 1, 2002
0.018
-0.014
-44.3%
jan 1, 2003
0.01
-0.008
-45.78%
jan 1, 2004
0.0
-0.01
-100.0%
jan 1, 2005
0.0
0.0
-100.04%
jan 1, 2006
0.0
0.0
311.16K%
jan 1, 2007
0.0
+0.0
-168.27%
jan 1, 2008
0.0
0.0
-83.17%
jan 1, 2009
0.0
0.0
-100.0%
jan 1, 2011
0.0
0.0
-307.12%
jan 1, 2012
0.0
0.0
53.11%
jan 1, 2013
0.0
+0.0
-137.48%
jan 1, 2014
0.0
+0.0
24.35%
jan 1, 2015
0.0
0.0
-100.0%
Ranking of countries by current statistics by years


Comments: