29
/
en
AIzaSyAYiBZKx7MnpbEhh9jyipgxe19OcubqV5w
April 1, 2024
77352
Bahrain
BHR
true
2
1
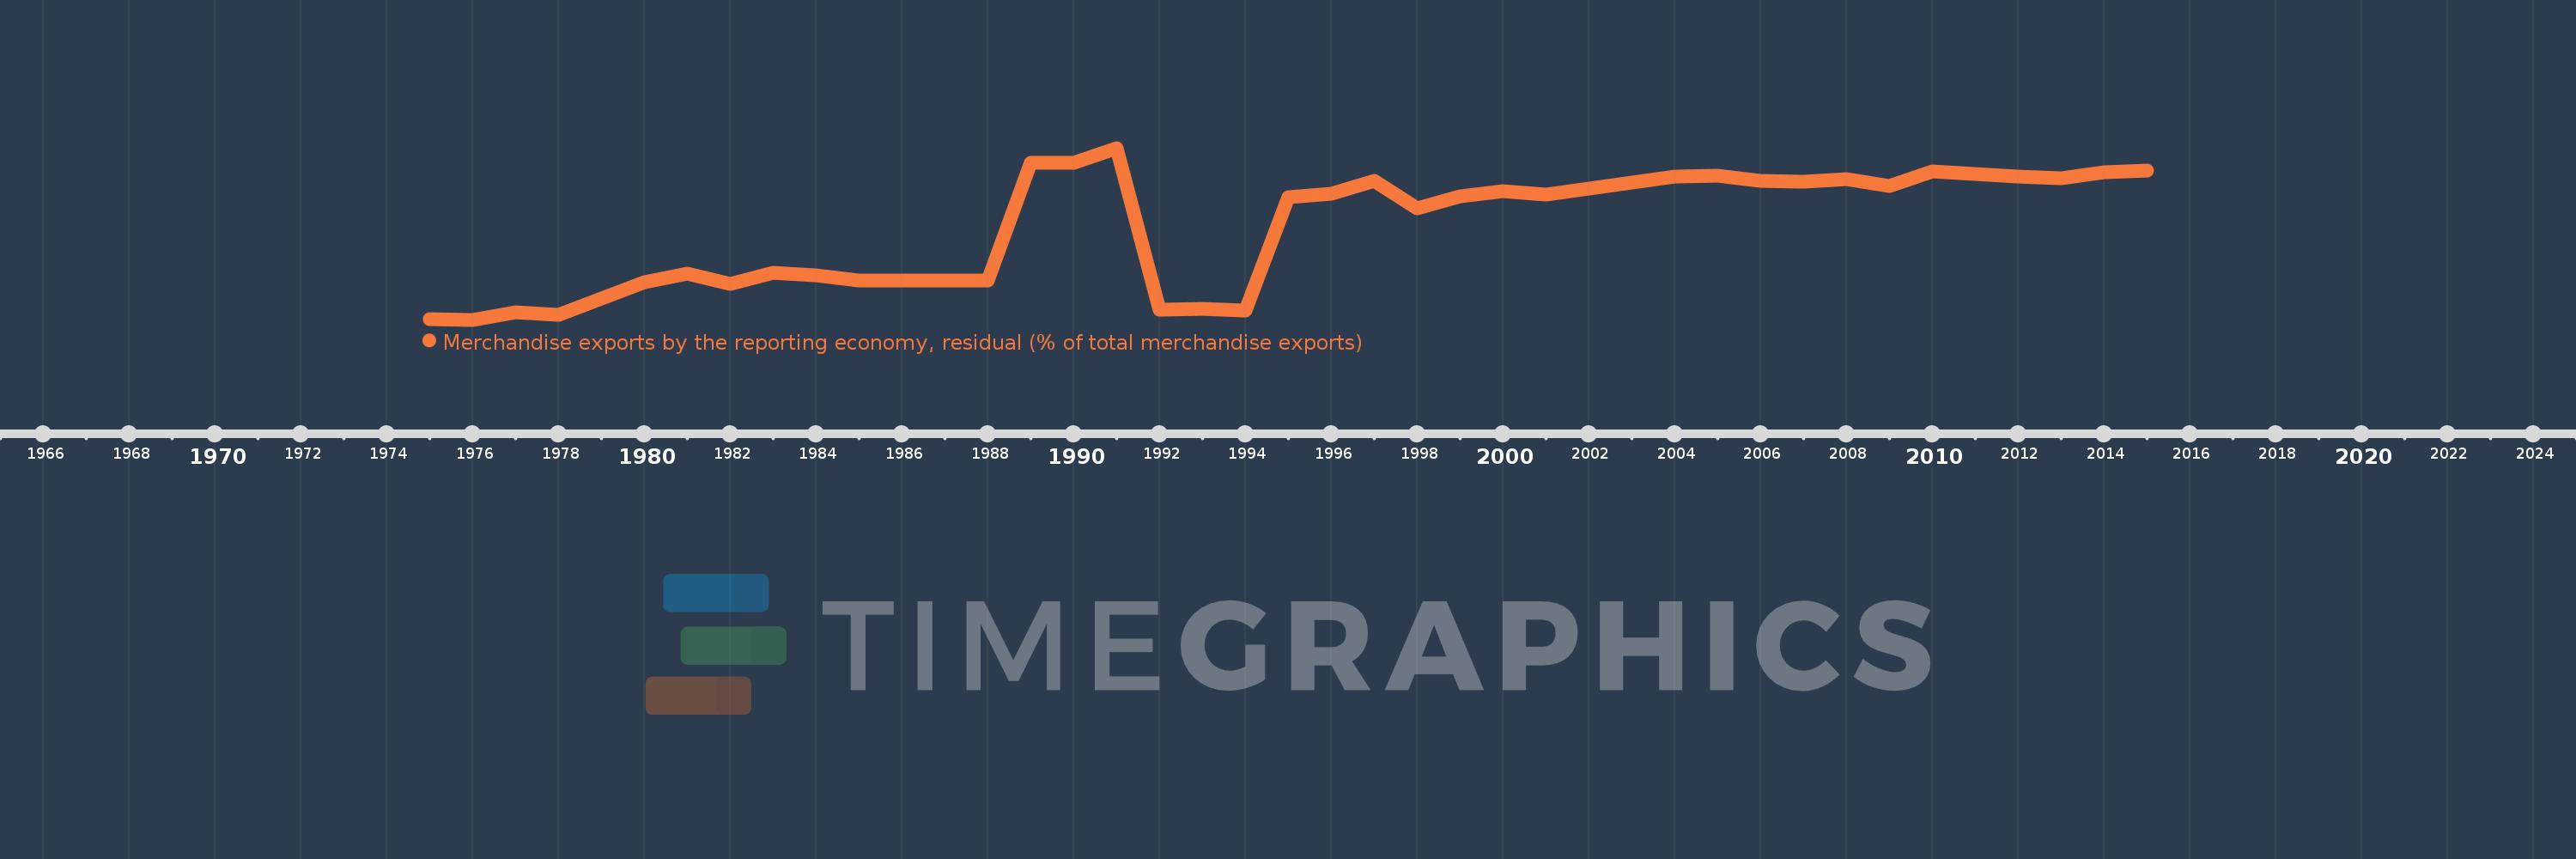
Merchandise exports by the reporting economy, residual (% of total merchandise exports)
2015,2014,2013,2012,2011,2010,2009,2008,2007,2006,2005,2004,2003,2002,2001,2000,1999,1998,1997,1996,1995,1994,1993,1992,1991,1990,1989,1988,1987,1986,1985,1984,1983,1982,1981,1980,1978,1977,1976,1975
This statistics in other country:
AfghanistanAlbaniaAlgeriaAmerican SamoaAngolaAntigua and BarbudaArab WorldArgentinaArmeniaArubaAustraliaAustriaAzerbaijanBahamas, TheBahrainBangladeshBarbadosBelarusBelgiumBelizeBeninBermudaBoliviaBosnia and HerzegovinaBrazilBrunei DarussalamBulgariaBurkina FasoBurundiCabo VerdeCambodiaCameroonCanadaCaribbean small statesCentral African RepublicCentral Europe and the BalticsChadChileChinaColombiaComorosCongo, Dem. Rep.Congo, Rep.Costa RicaCote d'IvoireCroatiaCubaCyprusCzech RepublicDenmarkDjiboutiDominicaDominican RepublicEarly-demographic dividendEast Asia & PacificEast Asia & Pacific (excluding high income)East Asia & Pacific (IDA & IBRD countries)EcuadorEgypt, Arab Rep.El SalvadorEquatorial GuineaEstoniaEthiopiaEuro areaEurope & Central AsiaEurope & Central Asia (excluding high income)Europe & Central Asia (IDA & IBRD countries)European UnionFaroe IslandsFijiFinlandFragile and conflict affected situationsFranceFrench PolynesiaGabonGambia, TheGeorgiaGermanyGhanaGibraltarGreeceGreenlandGrenadaGuamGuatemalaGuineaGuinea-BissauGuyanaHaitiHeavily indebted poor countries (HIPC)High incomeHondurasHong Kong SAR, ChinaHungaryIBRD onlyIcelandIDA & IBRD totalIDA blendIDA onlyIDA totalIndiaIndonesiaIran, Islamic Rep.IraqIrelandIsraelItalyJamaicaJapanJordanKazakhstanKenyaKiribatiKorea, Dem. People’s Rep.Korea, Rep.KosovoKuwaitKyrgyz RepublicLao PDRLate-demographic dividendLatin America & Caribbean Latin America & Caribbean (excluding high income)Latin America & the Caribbean (IDA & IBRD countries)LatviaLeast developed countries: UN classificationLebanonLiberiaLibyaLithuaniaLow & middle incomeLow incomeLower middle incomeLuxembourgMacao SAR, ChinaMacedonia, FYRMadagascarMalawiMalaysiaMaldivesMaliMaltaMauritaniaMauritiusMexicoMiddle East & North AfricaMiddle East & North Africa (excluding high income)Middle East & North Africa (IDA & IBRD countries)Middle incomeMoldovaMongoliaMontenegroMoroccoMozambiqueMyanmarNauruNepalNetherlandsNew CaledoniaNew ZealandNicaraguaNigerNigeriaNorth AmericaNorwayOECD membersOmanOther small statesPacific island small statesPakistanPanamaPapua New GuineaParaguayPeruPhilippinesPolandPortugalPost-demographic dividendPre-demographic dividendQatarRomaniaRussian FederationRwandaSamoaSao Tome and PrincipeSaudi ArabiaSenegalSerbiaSeychellesSierra LeoneSingaporeSlovak RepublicSloveniaSmall statesSolomon IslandsSomaliaSouth AfricaSouth AsiaSouth Asia (IDA & IBRD)SpainSri LankaSt. Kitts and NevisSt. LuciaSt. Vincent and the GrenadinesSub-Saharan Africa Sub-Saharan Africa (excluding high income)Sub-Saharan Africa (IDA & IBRD countries)SudanSurinameSwedenSwitzerlandSyrian Arab RepublicTajikistanTanzaniaThailandTogoTongaTrinidad and TobagoTunisiaTurkeyTurkmenistanTuvaluUgandaUkraineUnited Arab EmiratesUnited KingdomUnited StatesUpper middle incomeUruguayUzbekistanVanuatuVenezuela, RBVietnamWorldYemen, Rep.ZambiaZimbabwe Timeline:
This timeline shows a graph from 1975 to 2015 of Bahrain. No data until 1974. Number of actual observations by date: 40.
Source name:
World Development Indicators
Source organization:
World Bank staff estimates based data from International Monetary Fund's Direction of Trade database.
Categories, topics:
Private Sector, Trade
Last updated:
apr 23, 2017
Indicators value changes by year
Maximum:
84.288
jan 1, 1991
At the date of observation
Value
Absolute change
Change from previous value
jan 1, 1975
2.784
+2.784
0.0%
jan 1, 1976
2.506
-0.279
-10.01%
jan 1, 1977
6.196
+3.69
147.25%
jan 1, 1978
4.896
-1.3
-20.98%
jan 1, 1980
20.345
+15.449
315.56%
jan 1, 1981
24.292
+3.947
19.4%
jan 1, 1982
19.412
-4.88
-20.09%
jan 1, 1983
25.016
+5.604
28.87%
jan 1, 1984
23.826
-1.191
-4.76%
jan 1, 1985
21.2
-2.626
-11.02%
jan 1, 1986
21.2
+0.0
0.0%
jan 1, 1987
21.2
+0.0
0.0%
jan 1, 1989
77.071
+55.871
263.54%
jan 1, 1990
77.071
+0.0
0.0%
jan 1, 1991
84.288
+7.217
9.36%
jan 1, 1992
7.312
-76.976
-91.32%
jan 1, 1993
7.606
+0.294
4.02%
jan 1, 1994
6.968
-0.638
-8.39%
jan 1, 1995
61.056
+54.088
776.23%
jan 1, 1996
62.506
+1.45
2.38%
jan 1, 1997
68.715
+6.209
9.93%
jan 1, 1998
55.483
-13.232
-19.26%
jan 1, 1999
61.094
+5.611
10.11%
jan 1, 2000
63.609
+2.515
4.12%
jan 1, 2001
62.005
-1.605
-2.52%
jan 1, 2002
64.928
+2.923
4.71%
jan 1, 2003
67.999
+3.071
4.73%
jan 1, 2004
70.784
+2.785
4.1%
jan 1, 2005
71.178
+0.394
0.56%
jan 1, 2006
68.594
-2.584
-3.63%
jan 1, 2007
68.181
-0.413
-0.6%
jan 1, 2008
69.459
+1.278
1.87%
jan 1, 2009
66.186
-3.273
-4.71%
jan 1, 2010
73.212
+7.026
10.62%
jan 1, 2011
71.917
-1.295
-1.77%
jan 1, 2012
70.812
-1.105
-1.54%
jan 1, 2013
70.027
-0.785
-1.11%
jan 1, 2014
72.531
+2.504
3.58%
jan 1, 2015
73.686
+1.155
1.59%
Ranking of countries by current statistics by years


Comments: