29
/
en
AIzaSyAYiBZKx7MnpbEhh9jyipgxe19OcubqV5w
April 1, 2024
25894
Central Europe and the Baltics
CEB
false
2
1
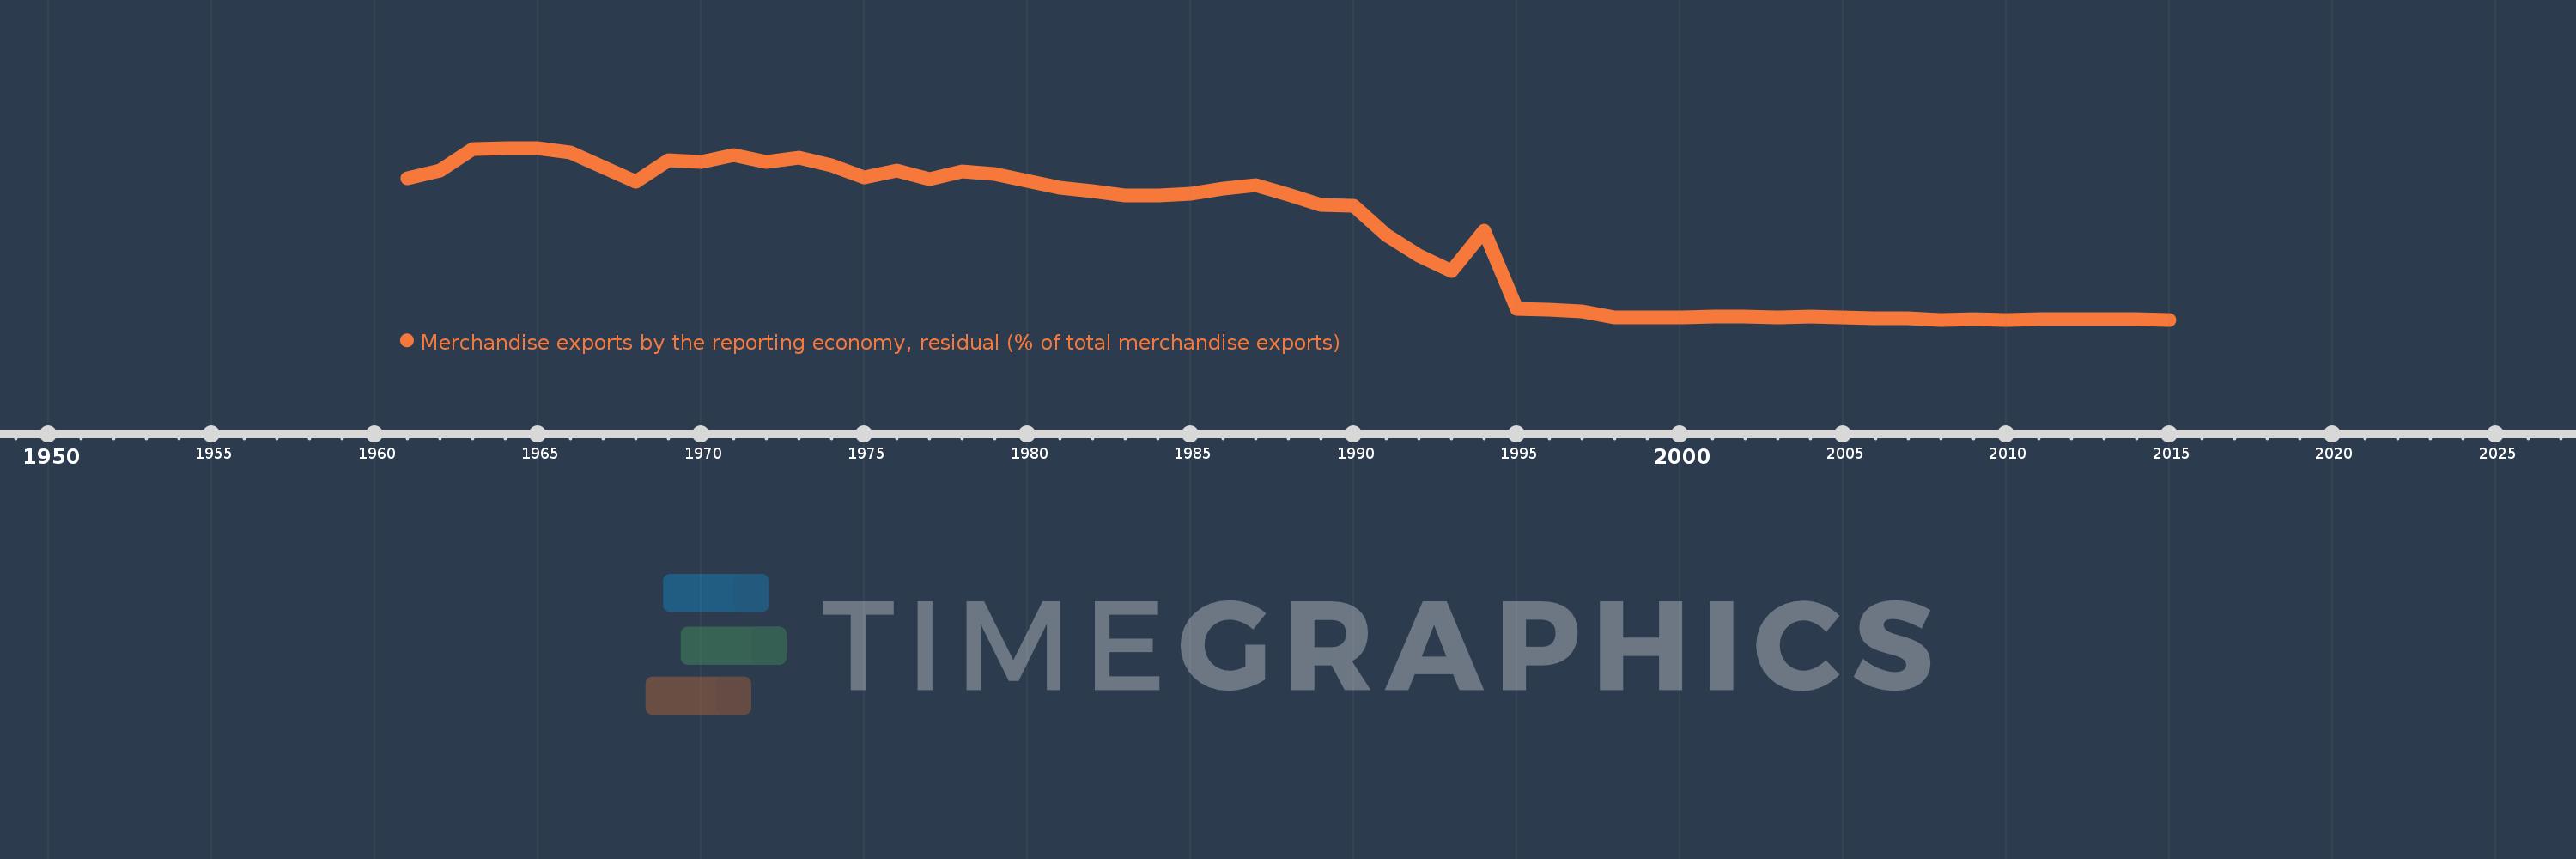
Merchandise exports by the reporting economy, residual (% of total merchandise exports)
2015,2014,2013,2012,2011,2010,2009,2008,2007,2006,2005,2004,2003,2002,2001,2000,1999,1998,1997,1996,1995,1994,1993,1992,1991,1990,1989,1988,1987,1986,1985,1984,1983,1982,1981,1980,1979,1978,1977,1976,1975,1974,1973,1972,1971,1970,1969,1968,1967,1966,1965,1964,1963,1962,1961
This statistics in other country:
AfghanistanAlbaniaAlgeriaAmerican SamoaAngolaAntigua and BarbudaArab WorldArgentinaArmeniaArubaAustraliaAustriaAzerbaijanBahamas, TheBahrainBangladeshBarbadosBelarusBelgiumBelizeBeninBermudaBoliviaBosnia and HerzegovinaBrazilBrunei DarussalamBulgariaBurkina FasoBurundiCabo VerdeCambodiaCameroonCanadaCaribbean small statesCentral African RepublicCentral Europe and the BalticsChadChileChinaColombiaComorosCongo, Dem. Rep.Congo, Rep.Costa RicaCote d'IvoireCroatiaCubaCyprusCzech RepublicDenmarkDjiboutiDominicaDominican RepublicEarly-demographic dividendEast Asia & PacificEast Asia & Pacific (excluding high income)East Asia & Pacific (IDA & IBRD countries)EcuadorEgypt, Arab Rep.El SalvadorEquatorial GuineaEstoniaEthiopiaEuro areaEurope & Central AsiaEurope & Central Asia (excluding high income)Europe & Central Asia (IDA & IBRD countries)European UnionFaroe IslandsFijiFinlandFragile and conflict affected situationsFranceFrench PolynesiaGabonGambia, TheGeorgiaGermanyGhanaGibraltarGreeceGreenlandGrenadaGuamGuatemalaGuineaGuinea-BissauGuyanaHaitiHeavily indebted poor countries (HIPC)High incomeHondurasHong Kong SAR, ChinaHungaryIBRD onlyIcelandIDA & IBRD totalIDA blendIDA onlyIDA totalIndiaIndonesiaIran, Islamic Rep.IraqIrelandIsraelItalyJamaicaJapanJordanKazakhstanKenyaKiribatiKorea, Dem. People’s Rep.Korea, Rep.KosovoKuwaitKyrgyz RepublicLao PDRLate-demographic dividendLatin America & Caribbean Latin America & Caribbean (excluding high income)Latin America & the Caribbean (IDA & IBRD countries)LatviaLeast developed countries: UN classificationLebanonLiberiaLibyaLithuaniaLow & middle incomeLow incomeLower middle incomeLuxembourgMacao SAR, ChinaMacedonia, FYRMadagascarMalawiMalaysiaMaldivesMaliMaltaMauritaniaMauritiusMexicoMiddle East & North AfricaMiddle East & North Africa (excluding high income)Middle East & North Africa (IDA & IBRD countries)Middle incomeMoldovaMongoliaMontenegroMoroccoMozambiqueMyanmarNauruNepalNetherlandsNew CaledoniaNew ZealandNicaraguaNigerNigeriaNorth AmericaNorwayOECD membersOmanOther small statesPacific island small statesPakistanPanamaPapua New GuineaParaguayPeruPhilippinesPolandPortugalPost-demographic dividendPre-demographic dividendQatarRomaniaRussian FederationRwandaSamoaSao Tome and PrincipeSaudi ArabiaSenegalSerbiaSeychellesSierra LeoneSingaporeSlovak RepublicSloveniaSmall statesSolomon IslandsSomaliaSouth AfricaSouth AsiaSouth Asia (IDA & IBRD)SpainSri LankaSt. Kitts and NevisSt. LuciaSt. Vincent and the GrenadinesSub-Saharan Africa Sub-Saharan Africa (excluding high income)Sub-Saharan Africa (IDA & IBRD countries)SudanSurinameSwedenSwitzerlandSyrian Arab RepublicTajikistanTanzaniaThailandTogoTongaTrinidad and TobagoTunisiaTurkeyTurkmenistanTuvaluUgandaUkraineUnited Arab EmiratesUnited KingdomUnited StatesUpper middle incomeUruguayUzbekistanVanuatuVenezuela, RBVietnamWorldYemen, Rep.ZambiaZimbabwe Timeline:
This timeline shows a graph from 1961 to 2015 of Central Europe and the Baltics. No data until 1960. Number of actual observations by date: 55.
Source name:
World Development Indicators
Source organization:
World Bank staff estimates based data from International Monetary Fund's Direction of Trade database.
Categories, topics:
Private Sector, Trade
Last updated:
apr 23, 2017
Indicators value changes by year
Maximum:
60.365
jan 1, 1964
At the date of observation
Value
Absolute change
Change from previous value
jan 1, 1961
49.771
+49.771
0.0%
jan 1, 1962
52.531
+2.759
5.54%
jan 1, 1963
60.054
+7.523
14.32%
jan 1, 1964
60.365
+0.311
0.52%
jan 1, 1965
60.314
-0.051
-0.08%
jan 1, 1966
58.777
-1.536
-2.55%
jan 1, 1967
53.796
-4.981
-8.47%
jan 1, 1968
48.54
-5.256
-9.77%
jan 1, 1969
56.113
+7.573
15.6%
jan 1, 1970
55.443
-0.67
-1.19%
jan 1, 1971
57.755
+2.312
4.17%
jan 1, 1972
55.608
-2.147
-3.72%
jan 1, 1973
56.833
+1.225
2.2%
jan 1, 1974
54.376
-2.457
-4.32%
jan 1, 1975
49.906
-4.47
-8.22%
jan 1, 1976
52.601
+2.695
5.4%
jan 1, 1977
49.527
-3.074
-5.84%
jan 1, 1978
52.096
+2.569
5.19%
jan 1, 1979
51.176
-0.92
-1.77%
jan 1, 1980
48.888
-2.288
-4.47%
jan 1, 1981
46.478
-2.41
-4.93%
jan 1, 1982
45.331
-1.147
-2.47%
jan 1, 1983
43.741
-1.59
-3.51%
jan 1, 1984
43.728
-0.013
-0.03%
jan 1, 1985
44.386
+0.658
1.5%
jan 1, 1986
46.052
+1.666
3.75%
jan 1, 1987
47.373
+1.321
2.87%
jan 1, 1988
44.11
-3.264
-6.89%
jan 1, 1989
40.348
-3.762
-8.53%
jan 1, 1990
40.057
-0.29
-0.72%
jan 1, 1991
29.965
-10.093
-25.2%
jan 1, 1992
22.588
-7.377
-24.62%
jan 1, 1993
17.347
-5.241
-23.2%
jan 1, 1994
31.508
+14.161
81.63%
jan 1, 1995
3.95
-27.557
-87.46%
jan 1, 1996
3.633
-0.317
-8.03%
jan 1, 1997
3.114
-0.519
-14.29%
jan 1, 1998
1.165
-1.949
-62.58%
jan 1, 1999
1.085
-0.08
-6.86%
jan 1, 2000
0.959
-0.127
-11.67%
jan 1, 2001
1.204
+0.245
25.6%
jan 1, 2002
1.323
+0.119
9.91%
jan 1, 2003
1.195
-0.128
-9.67%
jan 1, 2004
1.205
+0.01
0.83%
jan 1, 2005
1.13
-0.075
-6.25%
jan 1, 2006
0.899
-0.231
-20.42%
jan 1, 2007
0.636
-0.263
-29.26%
jan 1, 2008
0.287
-0.349
-54.83%
jan 1, 2009
0.365
+0.077
26.96%
jan 1, 2010
0.24
-0.125
-34.22%
jan 1, 2011
0.328
+0.089
36.9%
jan 1, 2012
0.401
+0.073
22.21%
jan 1, 2013
0.416
+0.014
3.56%
jan 1, 2014
0.325
-0.091
-21.83%
jan 1, 2015
0.275
-0.05
-15.39%
Ranking of countries by current statistics by years


Comments: