29
/
en
AIzaSyAYiBZKx7MnpbEhh9jyipgxe19OcubqV5w
April 1, 2024
73215
Australia
AUS
true
2
1
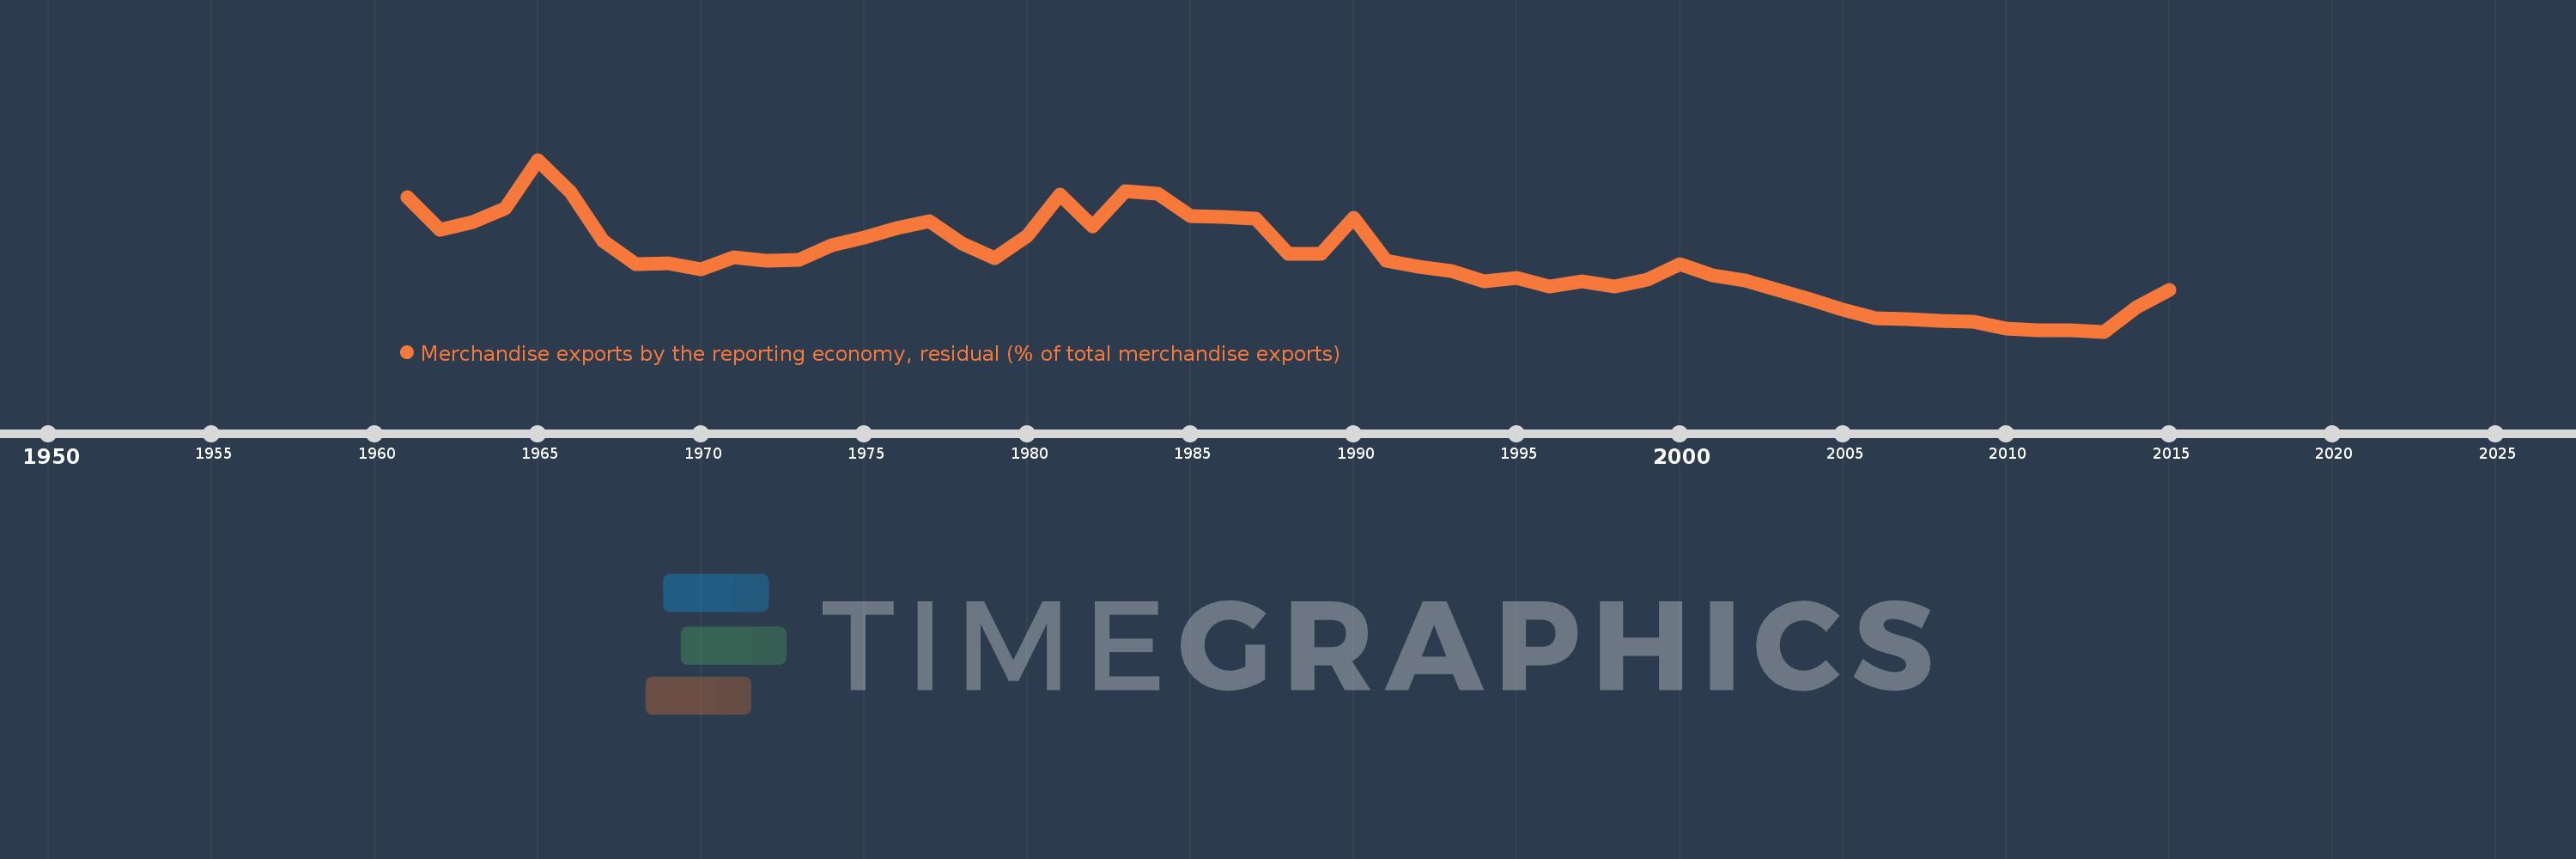
Merchandise exports by the reporting economy, residual (% of total merchandise exports)
2015,2014,2013,2012,2011,2010,2009,2008,2007,2006,2005,2004,2003,2002,2001,2000,1999,1998,1997,1996,1995,1994,1993,1992,1991,1990,1989,1988,1987,1986,1985,1984,1983,1982,1981,1980,1979,1978,1977,1976,1975,1974,1973,1972,1971,1970,1969,1968,1967,1966,1965,1964,1963,1962,1961
This statistics in other country:
AfghanistanAlbaniaAlgeriaAmerican SamoaAngolaAntigua and BarbudaArab WorldArgentinaArmeniaArubaAustraliaAustriaAzerbaijanBahamas, TheBahrainBangladeshBarbadosBelarusBelgiumBelizeBeninBermudaBoliviaBosnia and HerzegovinaBrazilBrunei DarussalamBulgariaBurkina FasoBurundiCabo VerdeCambodiaCameroonCanadaCaribbean small statesCentral African RepublicCentral Europe and the BalticsChadChileChinaColombiaComorosCongo, Dem. Rep.Congo, Rep.Costa RicaCote d'IvoireCroatiaCubaCyprusCzech RepublicDenmarkDjiboutiDominicaDominican RepublicEarly-demographic dividendEast Asia & PacificEast Asia & Pacific (excluding high income)East Asia & Pacific (IDA & IBRD countries)EcuadorEgypt, Arab Rep.El SalvadorEquatorial GuineaEstoniaEthiopiaEuro areaEurope & Central AsiaEurope & Central Asia (excluding high income)Europe & Central Asia (IDA & IBRD countries)European UnionFaroe IslandsFijiFinlandFragile and conflict affected situationsFranceFrench PolynesiaGabonGambia, TheGeorgiaGermanyGhanaGibraltarGreeceGreenlandGrenadaGuamGuatemalaGuineaGuinea-BissauGuyanaHaitiHeavily indebted poor countries (HIPC)High incomeHondurasHong Kong SAR, ChinaHungaryIBRD onlyIcelandIDA & IBRD totalIDA blendIDA onlyIDA totalIndiaIndonesiaIran, Islamic Rep.IraqIrelandIsraelItalyJamaicaJapanJordanKazakhstanKenyaKiribatiKorea, Dem. People’s Rep.Korea, Rep.KosovoKuwaitKyrgyz RepublicLao PDRLate-demographic dividendLatin America & Caribbean Latin America & Caribbean (excluding high income)Latin America & the Caribbean (IDA & IBRD countries)LatviaLeast developed countries: UN classificationLebanonLiberiaLibyaLithuaniaLow & middle incomeLow incomeLower middle incomeLuxembourgMacao SAR, ChinaMacedonia, FYRMadagascarMalawiMalaysiaMaldivesMaliMaltaMauritaniaMauritiusMexicoMiddle East & North AfricaMiddle East & North Africa (excluding high income)Middle East & North Africa (IDA & IBRD countries)Middle incomeMoldovaMongoliaMontenegroMoroccoMozambiqueMyanmarNauruNepalNetherlandsNew CaledoniaNew ZealandNicaraguaNigerNigeriaNorth AmericaNorwayOECD membersOmanOther small statesPacific island small statesPakistanPanamaPapua New GuineaParaguayPeruPhilippinesPolandPortugalPost-demographic dividendPre-demographic dividendQatarRomaniaRussian FederationRwandaSamoaSao Tome and PrincipeSaudi ArabiaSenegalSerbiaSeychellesSierra LeoneSingaporeSlovak RepublicSloveniaSmall statesSolomon IslandsSomaliaSouth AfricaSouth AsiaSouth Asia (IDA & IBRD)SpainSri LankaSt. Kitts and NevisSt. LuciaSt. Vincent and the GrenadinesSub-Saharan Africa Sub-Saharan Africa (excluding high income)Sub-Saharan Africa (IDA & IBRD countries)SudanSurinameSwedenSwitzerlandSyrian Arab RepublicTajikistanTanzaniaThailandTogoTongaTrinidad and TobagoTunisiaTurkeyTurkmenistanTuvaluUgandaUkraineUnited Arab EmiratesUnited KingdomUnited StatesUpper middle incomeUruguayUzbekistanVanuatuVenezuela, RBVietnamWorldYemen, Rep.ZambiaZimbabwe Timeline:
This timeline shows a graph from 1961 to 2015 of Australia. No data until 1960. Number of actual observations by date: 55.
Source name:
World Development Indicators
Source organization:
World Bank staff estimates based data from International Monetary Fund's Direction of Trade database.
Categories, topics:
Private Sector, Trade
Last updated:
apr 23, 2017
Indicators value changes by year
At the date of observation
Value
Absolute change
Change from previous value
jan 1, 1961
7.731
+7.731
0.0%
jan 1, 1962
6.077
-1.655
-21.41%
jan 1, 1963
6.475
+0.398
6.55%
jan 1, 1964
7.162
+0.688
10.62%
jan 1, 1965
9.663
+2.501
34.92%
jan 1, 1966
8.034
-1.629
-16.86%
jan 1, 1967
5.493
-2.541
-31.63%
jan 1, 1968
4.345
-1.148
-20.89%
jan 1, 1969
4.388
+0.043
0.98%
jan 1, 1970
4.041
-0.347
-7.9%
jan 1, 1971
4.687
+0.646
15.98%
jan 1, 1972
4.479
-0.208
-4.44%
jan 1, 1973
4.542
+0.063
1.41%
jan 1, 1974
5.311
+0.769
16.93%
jan 1, 1975
5.702
+0.392
7.37%
jan 1, 1976
6.16
+0.458
8.02%
jan 1, 1977
6.505
+0.345
5.61%
jan 1, 1978
5.362
-1.143
-17.57%
jan 1, 1979
4.64
-0.723
-13.48%
jan 1, 1980
5.772
+1.132
24.39%
jan 1, 1981
7.883
+2.112
36.58%
jan 1, 1982
6.25
-1.633
-20.72%
jan 1, 1983
8.057
+1.808
28.93%
jan 1, 1984
7.941
-0.116
-1.44%
jan 1, 1985
6.776
-1.166
-14.68%
jan 1, 1986
6.758
-0.018
-0.26%
jan 1, 1987
6.635
-0.123
-1.82%
jan 1, 1988
4.871
-1.764
-26.59%
jan 1, 1989
4.87
-0.001
-0.01%
jan 1, 1990
6.713
+1.843
37.84%
jan 1, 1991
4.499
-2.214
-32.98%
jan 1, 1992
4.186
-0.313
-6.96%
jan 1, 1993
3.975
-0.211
-5.04%
jan 1, 1994
3.456
-0.519
-13.06%
jan 1, 1995
3.605
+0.149
4.32%
jan 1, 1996
3.167
-0.438
-12.15%
jan 1, 1997
3.467
+0.299
9.46%
jan 1, 1998
3.2
-0.267
-7.7%
jan 1, 1999
3.516
+0.317
9.9%
jan 1, 2000
4.307
+0.791
22.5%
jan 1, 2001
3.764
-0.543
-12.61%
jan 1, 2002
3.468
-0.296
-7.86%
jan 1, 2003
2.992
-0.477
-13.75%
jan 1, 2004
2.538
-0.454
-15.16%
jan 1, 2005
1.974
-0.564
-22.21%
jan 1, 2006
1.561
-0.413
-20.93%
jan 1, 2007
1.503
-0.058
-3.71%
jan 1, 2008
1.424
-0.08
-5.29%
jan 1, 2009
1.372
-0.052
-3.63%
jan 1, 2010
1.047
-0.325
-23.68%
jan 1, 2011
0.946
-0.101
-9.68%
jan 1, 2012
0.949
+0.003
0.28%
jan 1, 2013
0.875
-0.074
-7.76%
jan 1, 2014
2.136
+1.261
144.14%
jan 1, 2015
3.01
+0.874
40.9%
Ranking of countries by current statistics by years


Comments: