29
/
en
AIzaSyAYiBZKx7MnpbEhh9jyipgxe19OcubqV5w
April 1, 2024
36756
IBRD only
IBD
false
2
1
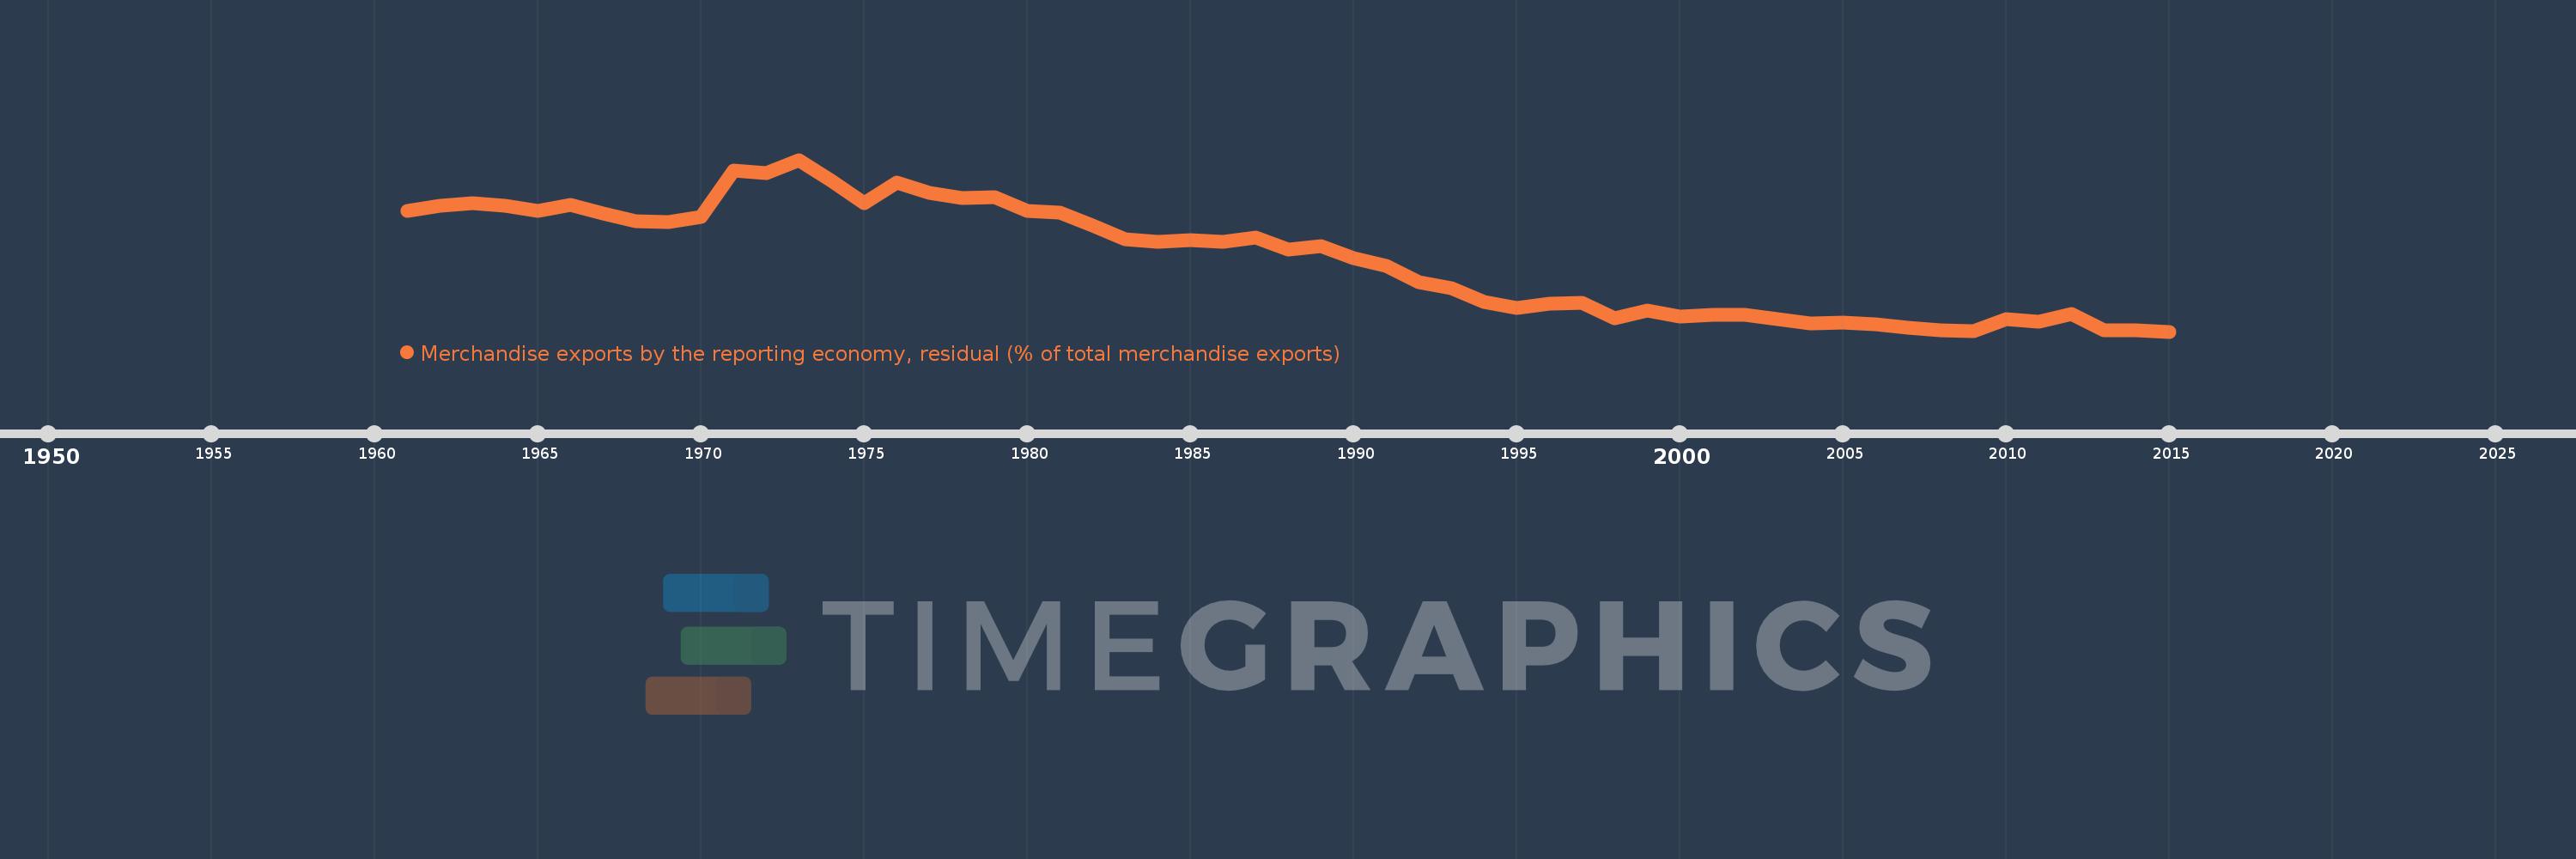
Merchandise exports by the reporting economy, residual (% of total merchandise exports)
2015,2014,2013,2012,2011,2010,2009,2008,2007,2006,2005,2004,2003,2002,2001,2000,1999,1998,1997,1996,1995,1994,1993,1992,1991,1990,1989,1988,1987,1986,1985,1984,1983,1982,1981,1980,1979,1978,1977,1976,1975,1974,1973,1972,1971,1970,1969,1968,1967,1966,1965,1964,1963,1962,1961
This statistics in other country:
AfghanistanAlbaniaAlgeriaAmerican SamoaAngolaAntigua and BarbudaArab WorldArgentinaArmeniaArubaAustraliaAustriaAzerbaijanBahamas, TheBahrainBangladeshBarbadosBelarusBelgiumBelizeBeninBermudaBoliviaBosnia and HerzegovinaBrazilBrunei DarussalamBulgariaBurkina FasoBurundiCabo VerdeCambodiaCameroonCanadaCaribbean small statesCentral African RepublicCentral Europe and the BalticsChadChileChinaColombiaComorosCongo, Dem. Rep.Congo, Rep.Costa RicaCote d'IvoireCroatiaCubaCyprusCzech RepublicDenmarkDjiboutiDominicaDominican RepublicEarly-demographic dividendEast Asia & PacificEast Asia & Pacific (excluding high income)East Asia & Pacific (IDA & IBRD countries)EcuadorEgypt, Arab Rep.El SalvadorEquatorial GuineaEstoniaEthiopiaEuro areaEurope & Central AsiaEurope & Central Asia (excluding high income)Europe & Central Asia (IDA & IBRD countries)European UnionFaroe IslandsFijiFinlandFragile and conflict affected situationsFranceFrench PolynesiaGabonGambia, TheGeorgiaGermanyGhanaGibraltarGreeceGreenlandGrenadaGuamGuatemalaGuineaGuinea-BissauGuyanaHaitiHeavily indebted poor countries (HIPC)High incomeHondurasHong Kong SAR, ChinaHungaryIBRD onlyIcelandIDA & IBRD totalIDA blendIDA onlyIDA totalIndiaIndonesiaIran, Islamic Rep.IraqIrelandIsraelItalyJamaicaJapanJordanKazakhstanKenyaKiribatiKorea, Dem. People’s Rep.Korea, Rep.KosovoKuwaitKyrgyz RepublicLao PDRLate-demographic dividendLatin America & Caribbean Latin America & Caribbean (excluding high income)Latin America & the Caribbean (IDA & IBRD countries)LatviaLeast developed countries: UN classificationLebanonLiberiaLibyaLithuaniaLow & middle incomeLow incomeLower middle incomeLuxembourgMacao SAR, ChinaMacedonia, FYRMadagascarMalawiMalaysiaMaldivesMaliMaltaMauritaniaMauritiusMexicoMiddle East & North AfricaMiddle East & North Africa (excluding high income)Middle East & North Africa (IDA & IBRD countries)Middle incomeMoldovaMongoliaMontenegroMoroccoMozambiqueMyanmarNauruNepalNetherlandsNew CaledoniaNew ZealandNicaraguaNigerNigeriaNorth AmericaNorwayOECD membersOmanOther small statesPacific island small statesPakistanPanamaPapua New GuineaParaguayPeruPhilippinesPolandPortugalPost-demographic dividendPre-demographic dividendQatarRomaniaRussian FederationRwandaSamoaSao Tome and PrincipeSaudi ArabiaSenegalSerbiaSeychellesSierra LeoneSingaporeSlovak RepublicSloveniaSmall statesSolomon IslandsSomaliaSouth AfricaSouth AsiaSouth Asia (IDA & IBRD)SpainSri LankaSt. Kitts and NevisSt. LuciaSt. Vincent and the GrenadinesSub-Saharan Africa Sub-Saharan Africa (excluding high income)Sub-Saharan Africa (IDA & IBRD countries)SudanSurinameSwedenSwitzerlandSyrian Arab RepublicTajikistanTanzaniaThailandTogoTongaTrinidad and TobagoTunisiaTurkeyTurkmenistanTuvaluUgandaUkraineUnited Arab EmiratesUnited KingdomUnited StatesUpper middle incomeUruguayUzbekistanVanuatuVenezuela, RBVietnamWorldYemen, Rep.ZambiaZimbabwe Timeline:
This timeline shows a graph from 1961 to 2015 of IBRD only. No data until 1960. Number of actual observations by date: 55.
Source name:
World Development Indicators
Source organization:
World Bank staff estimates based data from International Monetary Fund's Direction of Trade database.
Categories, topics:
Private Sector, Trade
Last updated:
apr 23, 2017
Indicators value changes by year
Maximum:
19.218
jan 1, 1973
At the date of observation
Value
Absolute change
Change from previous value
jan 1, 1961
13.909
+13.909
0.0%
jan 1, 1962
14.456
+0.547
3.93%
jan 1, 1963
14.756
+0.3
2.08%
jan 1, 1964
14.469
-0.287
-1.94%
jan 1, 1965
13.919
-0.55
-3.8%
jan 1, 1966
14.556
+0.637
4.58%
jan 1, 1967
13.636
-0.92
-6.32%
jan 1, 1968
12.847
-0.789
-5.78%
jan 1, 1969
12.749
-0.098
-0.76%
jan 1, 1970
13.298
+0.549
4.3%
jan 1, 1971
18.134
+4.835
36.36%
jan 1, 1972
17.869
-0.264
-1.46%
jan 1, 1973
19.218
+1.349
7.55%
jan 1, 1974
17.046
-2.172
-11.3%
jan 1, 1975
14.714
-2.332
-13.68%
jan 1, 1976
16.845
+2.131
14.48%
jan 1, 1977
15.772
-1.072
-6.37%
jan 1, 1978
15.235
-0.537
-3.4%
jan 1, 1979
15.337
+0.102
0.67%
jan 1, 1980
13.895
-1.442
-9.4%
jan 1, 1981
13.751
-0.144
-1.04%
jan 1, 1982
12.428
-1.323
-9.62%
jan 1, 1983
10.934
-1.494
-12.02%
jan 1, 1984
10.703
-0.231
-2.11%
jan 1, 1985
10.88
+0.177
1.65%
jan 1, 1986
10.686
-0.194
-1.78%
jan 1, 1987
11.174
+0.488
4.56%
jan 1, 1988
9.904
-1.27
-11.37%
jan 1, 1989
10.232
+0.329
3.32%
jan 1, 1990
8.992
-1.241
-12.13%
jan 1, 1991
8.185
-0.807
-8.97%
jan 1, 1992
6.517
-1.668
-20.38%
jan 1, 1993
5.914
-0.602
-9.24%
jan 1, 1994
4.493
-1.421
-24.03%
jan 1, 1995
3.793
-0.7
-15.57%
jan 1, 1996
4.244
+0.451
11.88%
jan 1, 1997
4.381
+0.137
3.22%
jan 1, 1998
2.736
-1.645
-37.55%
jan 1, 1999
3.584
+0.848
30.99%
jan 1, 2000
2.976
-0.607
-16.95%
jan 1, 2001
3.082
+0.105
3.53%
jan 1, 2002
3.088
+0.006
0.2%
jan 1, 2003
2.709
-0.379
-12.28%
jan 1, 2004
2.255
-0.453
-16.74%
jan 1, 2005
2.293
+0.038
1.67%
jan 1, 2006
2.178
-0.115
-5.01%
jan 1, 2007
1.749
-0.429
-19.7%
jan 1, 2008
1.485
-0.264
-15.07%
jan 1, 2009
1.434
-0.051
-3.44%
jan 1, 2010
2.654
+1.219
85.02%
jan 1, 2011
2.435
-0.219
-8.24%
jan 1, 2012
3.213
+0.778
31.95%
jan 1, 2013
1.505
-1.708
-53.16%
jan 1, 2014
1.536
+0.031
2.03%
jan 1, 2015
1.377
-0.158
-10.3%
Ranking of countries by current statistics by years


Comments: