29
/
en
AIzaSyAYiBZKx7MnpbEhh9jyipgxe19OcubqV5w
April 1, 2024
44425
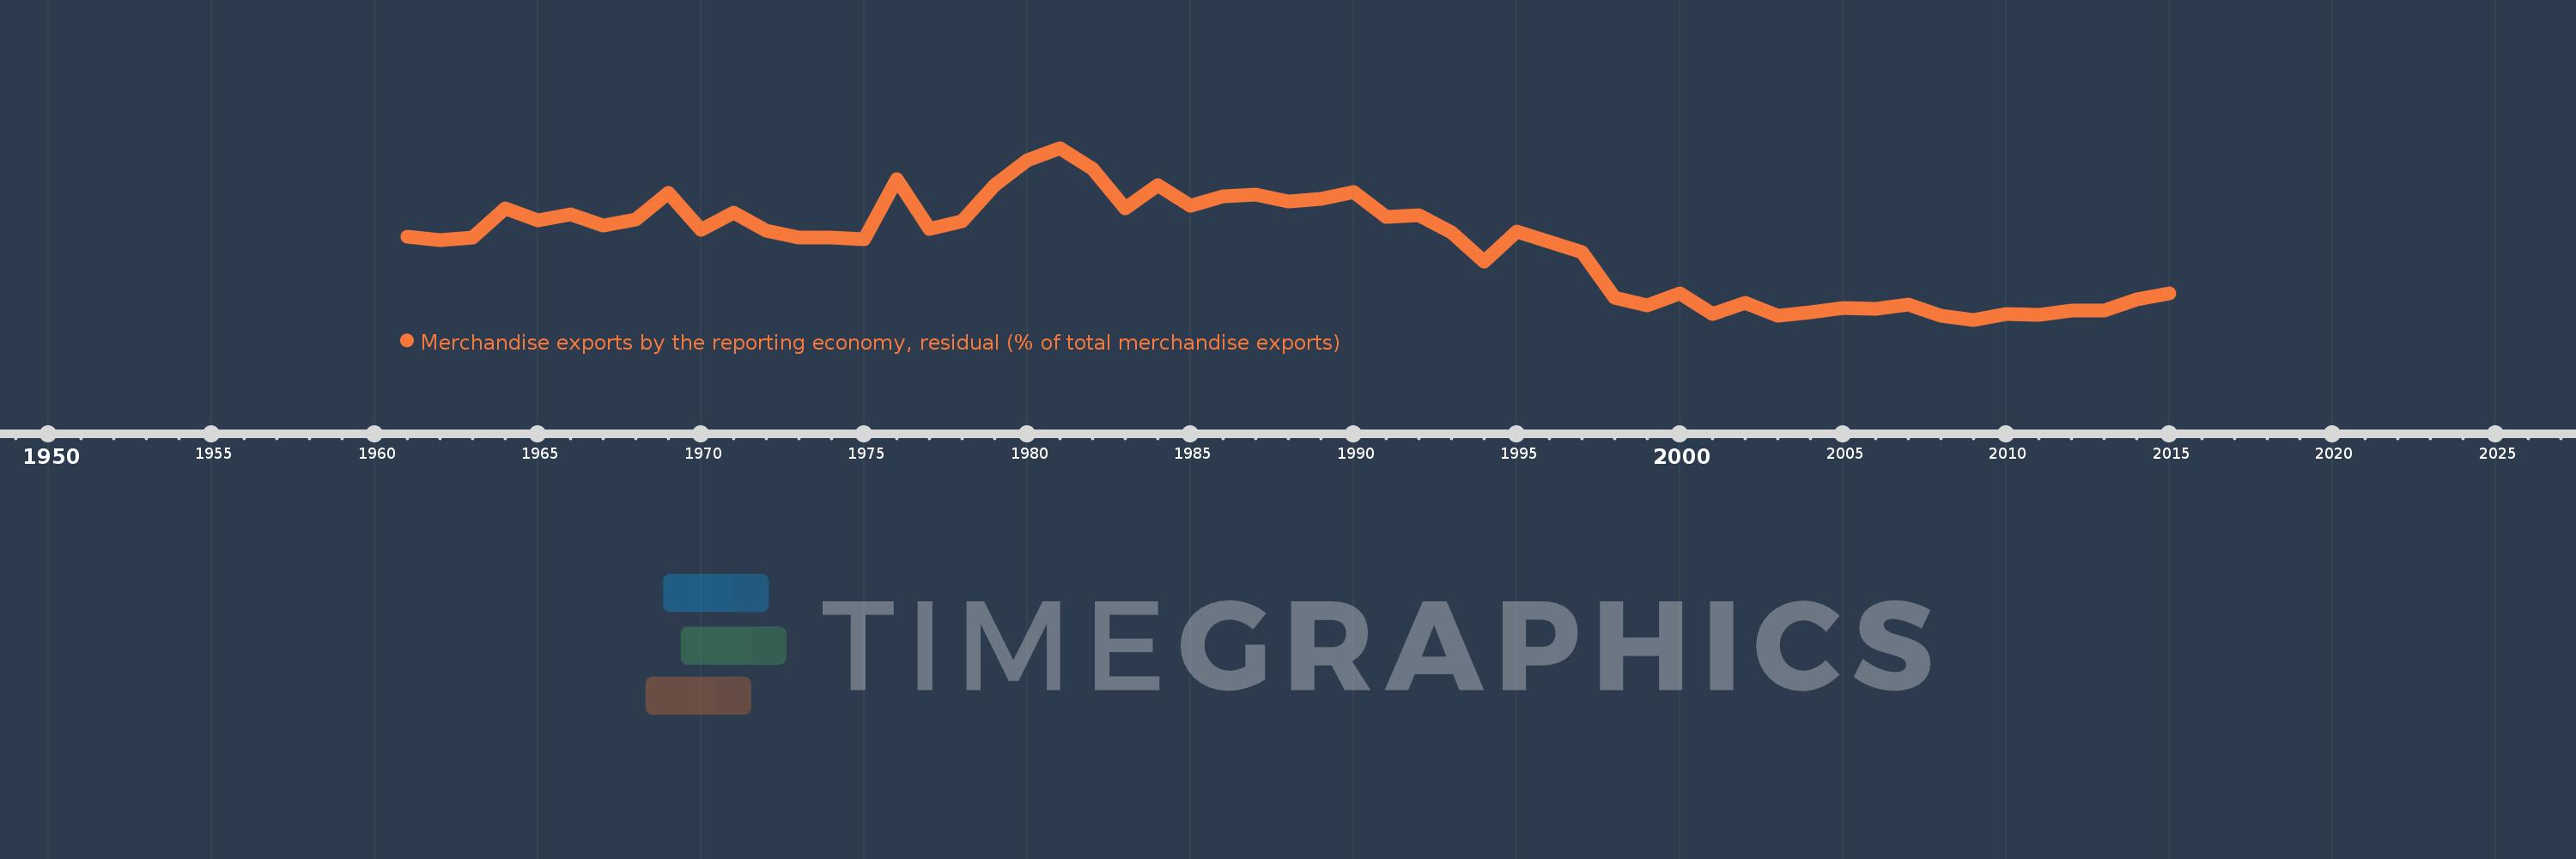
Least developed countries: UN classification
LDC
false
2
1
Merchandise exports by the reporting economy, residual (% of total merchandise exports)
2015,2014,2013,2012,2011,2010,2009,2008,2007,2006,2005,2004,2003,2002,2001,2000,1999,1998,1997,1996,1995,1994,1993,1992,1991,1990,1989,1988,1987,1986,1985,1984,1983,1982,1981,1980,1979,1978,1977,1976,1975,1974,1973,1972,1971,1970,1969,1968,1967,1966,1965,1964,1963,1962,1961
This statistics in other country:
AfghanistanAlbaniaAlgeriaAmerican SamoaAngolaAntigua and BarbudaArab WorldArgentinaArmeniaArubaAustraliaAustriaAzerbaijanBahamas, TheBahrainBangladeshBarbadosBelarusBelgiumBelizeBeninBermudaBoliviaBosnia and HerzegovinaBrazilBrunei DarussalamBulgariaBurkina FasoBurundiCabo VerdeCambodiaCameroonCanadaCaribbean small statesCentral African RepublicCentral Europe and the BalticsChadChileChinaColombiaComorosCongo, Dem. Rep.Congo, Rep.Costa RicaCote d'IvoireCroatiaCubaCyprusCzech RepublicDenmarkDjiboutiDominicaDominican RepublicEarly-demographic dividendEast Asia & PacificEast Asia & Pacific (excluding high income)East Asia & Pacific (IDA & IBRD countries)EcuadorEgypt, Arab Rep.El SalvadorEquatorial GuineaEstoniaEthiopiaEuro areaEurope & Central AsiaEurope & Central Asia (excluding high income)Europe & Central Asia (IDA & IBRD countries)European UnionFaroe IslandsFijiFinlandFragile and conflict affected situationsFranceFrench PolynesiaGabonGambia, TheGeorgiaGermanyGhanaGibraltarGreeceGreenlandGrenadaGuamGuatemalaGuineaGuinea-BissauGuyanaHaitiHeavily indebted poor countries (HIPC)High incomeHondurasHong Kong SAR, ChinaHungaryIBRD onlyIcelandIDA & IBRD totalIDA blendIDA onlyIDA totalIndiaIndonesiaIran, Islamic Rep.IraqIrelandIsraelItalyJamaicaJapanJordanKazakhstanKenyaKiribatiKorea, Dem. People’s Rep.Korea, Rep.KosovoKuwaitKyrgyz RepublicLao PDRLate-demographic dividendLatin America & Caribbean Latin America & Caribbean (excluding high income)Latin America & the Caribbean (IDA & IBRD countries)LatviaLeast developed countries: UN classificationLebanonLiberiaLibyaLithuaniaLow & middle incomeLow incomeLower middle incomeLuxembourgMacao SAR, ChinaMacedonia, FYRMadagascarMalawiMalaysiaMaldivesMaliMaltaMauritaniaMauritiusMexicoMiddle East & North AfricaMiddle East & North Africa (excluding high income)Middle East & North Africa (IDA & IBRD countries)Middle incomeMoldovaMongoliaMontenegroMoroccoMozambiqueMyanmarNauruNepalNetherlandsNew CaledoniaNew ZealandNicaraguaNigerNigeriaNorth AmericaNorwayOECD membersOmanOther small statesPacific island small statesPakistanPanamaPapua New GuineaParaguayPeruPhilippinesPolandPortugalPost-demographic dividendPre-demographic dividendQatarRomaniaRussian FederationRwandaSamoaSao Tome and PrincipeSaudi ArabiaSenegalSerbiaSeychellesSierra LeoneSingaporeSlovak RepublicSloveniaSmall statesSolomon IslandsSomaliaSouth AfricaSouth AsiaSouth Asia (IDA & IBRD)SpainSri LankaSt. Kitts and NevisSt. LuciaSt. Vincent and the GrenadinesSub-Saharan Africa Sub-Saharan Africa (excluding high income)Sub-Saharan Africa (IDA & IBRD countries)SudanSurinameSwedenSwitzerlandSyrian Arab RepublicTajikistanTanzaniaThailandTogoTongaTrinidad and TobagoTunisiaTurkeyTurkmenistanTuvaluUgandaUkraineUnited Arab EmiratesUnited KingdomUnited StatesUpper middle incomeUruguayUzbekistanVanuatuVenezuela, RBVietnamWorldYemen, Rep.ZambiaZimbabwe Timeline:
This timeline shows a graph from 1961 to 2015 of Least developed countries: UN classification. No data until 1960. Number of actual observations by date: 55.
Source name:
World Development Indicators
Source organization:
World Bank staff estimates based data from International Monetary Fund's Direction of Trade database.
Categories, topics:
Private Sector, Trade
Last updated:
apr 23, 2017
Indicators value changes by year
Maximum:
30.133
jan 1, 1981
At the date of observation
Value
Absolute change
Change from previous value
jan 1, 1961
17.505
+17.505
0.0%
jan 1, 1962
16.949
-0.556
-3.17%
jan 1, 1963
17.394
+0.445
2.63%
jan 1, 1964
21.488
+4.094
23.54%
jan 1, 1965
19.807
-1.681
-7.82%
jan 1, 1966
20.705
+0.898
4.53%
jan 1, 1967
19.121
-1.584
-7.65%
jan 1, 1968
19.875
+0.754
3.94%
jan 1, 1969
23.784
+3.909
19.67%
jan 1, 1970
18.458
-5.326
-22.39%
jan 1, 1971
20.912
+2.455
13.3%
jan 1, 1972
18.283
-2.629
-12.57%
jan 1, 1973
17.362
-0.921
-5.04%
jan 1, 1974
17.298
-0.064
-0.37%
jan 1, 1975
17.065
-0.233
-1.35%
jan 1, 1976
25.682
+8.617
50.5%
jan 1, 1977
18.606
-7.076
-27.55%
jan 1, 1978
19.647
+1.041
5.6%
jan 1, 1979
24.808
+5.161
26.27%
jan 1, 1980
28.41
+3.601
14.52%
jan 1, 1981
30.133
+1.723
6.07%
jan 1, 1982
27.182
-2.951
-9.79%
jan 1, 1983
21.467
-5.715
-21.02%
jan 1, 1984
24.777
+3.31
15.42%
jan 1, 1985
21.864
-2.912
-11.75%
jan 1, 1986
23.28
+1.416
6.47%
jan 1, 1987
23.497
+0.217
0.93%
jan 1, 1988
22.445
-1.053
-4.48%
jan 1, 1989
22.855
+0.41
1.83%
jan 1, 1990
23.826
+0.971
4.25%
jan 1, 1991
20.264
-3.562
-14.95%
jan 1, 1992
20.483
+0.219
1.08%
jan 1, 1993
18.049
-2.434
-11.88%
jan 1, 1994
13.957
-4.093
-22.67%
jan 1, 1995
18.183
+4.226
30.28%
jan 1, 1996
16.696
-1.486
-8.17%
jan 1, 1997
15.267
-1.43
-8.56%
jan 1, 1998
8.778
-6.489
-42.5%
jan 1, 1999
7.694
-1.084
-12.35%
jan 1, 2000
9.409
+1.715
22.29%
jan 1, 2001
6.505
-2.903
-30.86%
jan 1, 2002
8.013
+1.507
23.17%
jan 1, 2003
6.249
-1.764
-22.01%
jan 1, 2004
6.632
+0.383
6.13%
jan 1, 2005
7.306
+0.674
10.16%
jan 1, 2006
7.217
-0.089
-1.21%
jan 1, 2007
7.786
+0.569
7.88%
jan 1, 2008
6.238
-1.548
-19.88%
jan 1, 2009
5.623
-0.615
-9.86%
jan 1, 2010
6.383
+0.76
13.52%
jan 1, 2011
6.348
-0.035
-0.55%
jan 1, 2012
6.876
+0.527
8.31%
jan 1, 2013
6.975
+0.1
1.45%
jan 1, 2014
8.502
+1.526
21.88%
jan 1, 2015
9.432
+0.93
10.94%
Ranking of countries by current statistics by years


Comments: