29
/
en
AIzaSyAYiBZKx7MnpbEhh9jyipgxe19OcubqV5w
April 1, 2024
145926
Guinea
GIN
true
2
1
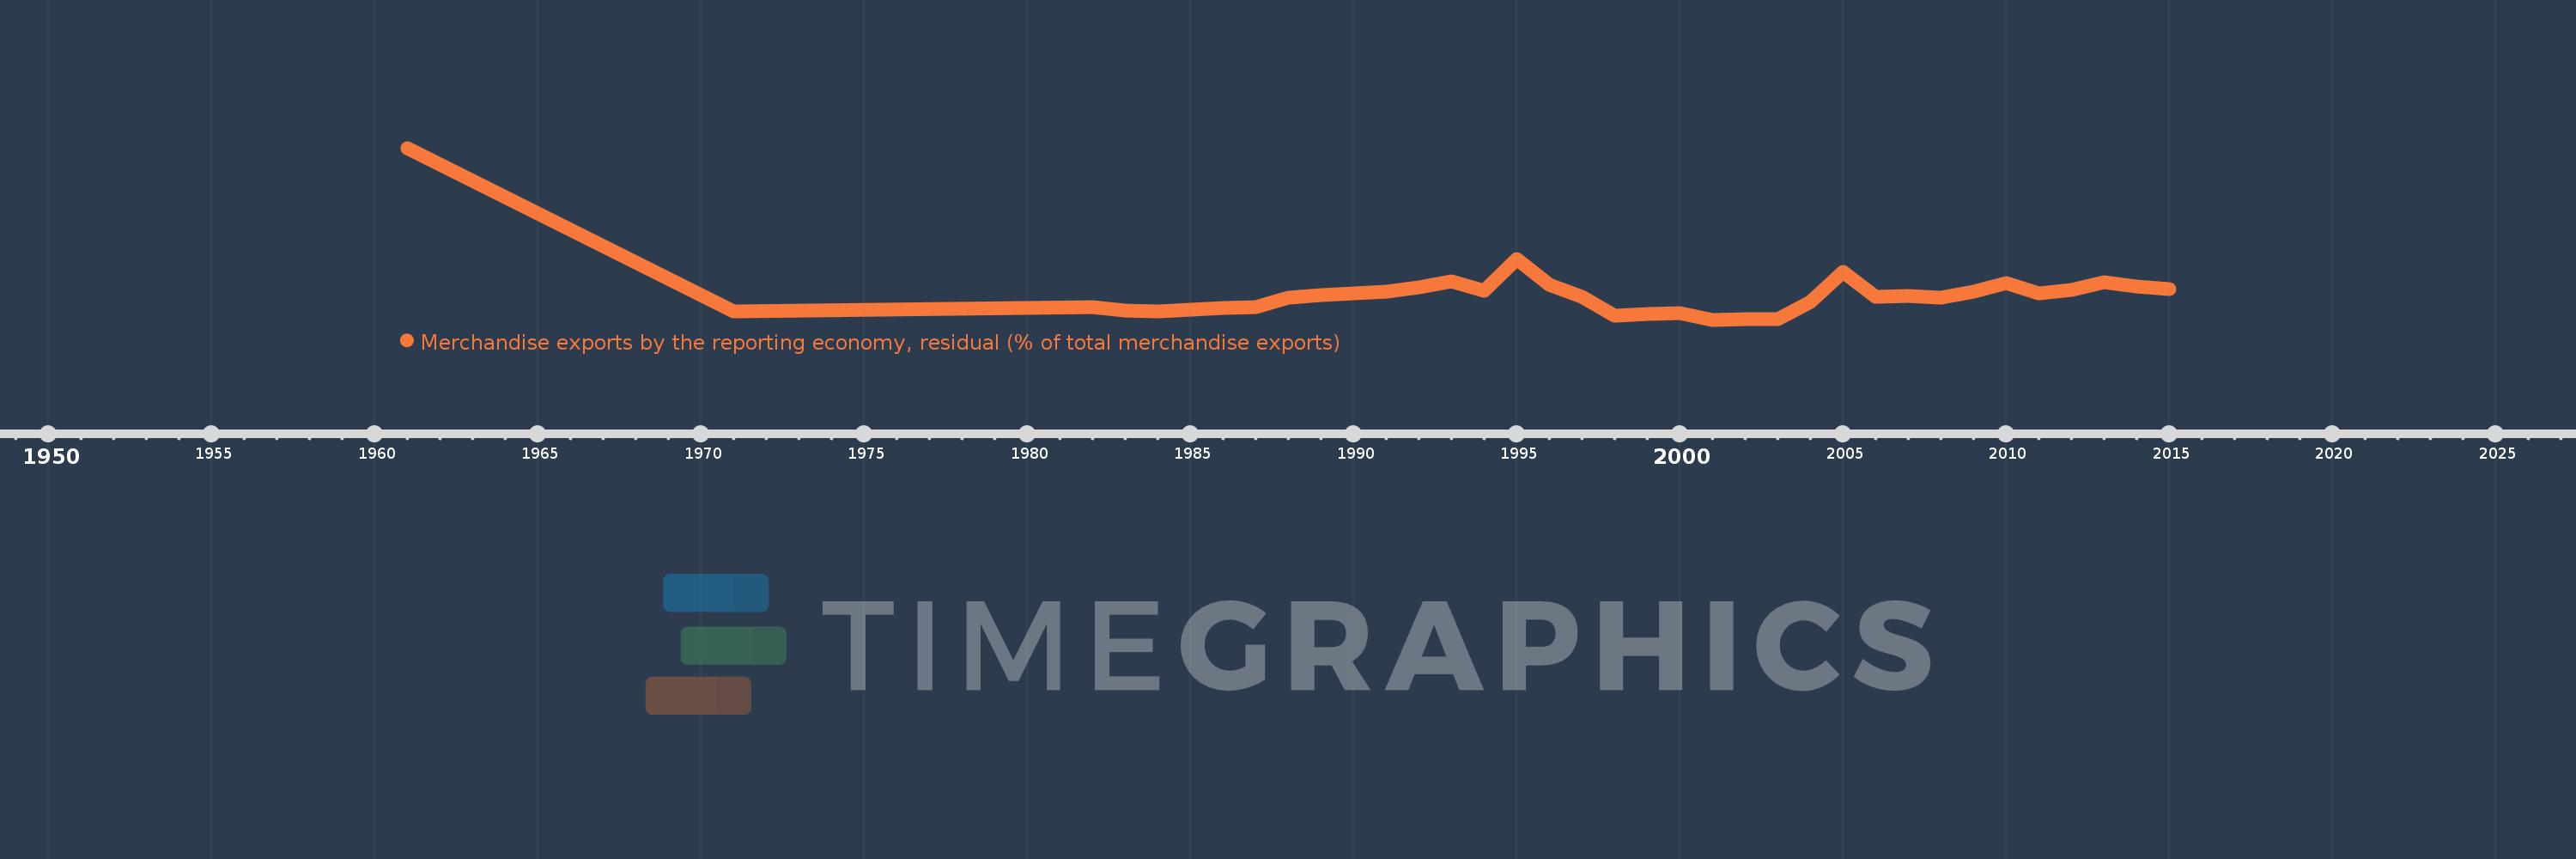
Merchandise exports by the reporting economy, residual (% of total merchandise exports)
2015,2014,2013,2012,2011,2010,2009,2008,2007,2006,2005,2004,2003,2002,2001,2000,1999,1998,1997,1996,1995,1994,1993,1992,1991,1990,1989,1988,1987,1986,1985,1984,1983,1982,1971,1961
This statistics in other country:
AfghanistanAlbaniaAlgeriaAmerican SamoaAngolaAntigua and BarbudaArab WorldArgentinaArmeniaArubaAustraliaAustriaAzerbaijanBahamas, TheBahrainBangladeshBarbadosBelarusBelgiumBelizeBeninBermudaBoliviaBosnia and HerzegovinaBrazilBrunei DarussalamBulgariaBurkina FasoBurundiCabo VerdeCambodiaCameroonCanadaCaribbean small statesCentral African RepublicCentral Europe and the BalticsChadChileChinaColombiaComorosCongo, Dem. Rep.Congo, Rep.Costa RicaCote d'IvoireCroatiaCubaCyprusCzech RepublicDenmarkDjiboutiDominicaDominican RepublicEarly-demographic dividendEast Asia & PacificEast Asia & Pacific (excluding high income)East Asia & Pacific (IDA & IBRD countries)EcuadorEgypt, Arab Rep.El SalvadorEquatorial GuineaEstoniaEthiopiaEuro areaEurope & Central AsiaEurope & Central Asia (excluding high income)Europe & Central Asia (IDA & IBRD countries)European UnionFaroe IslandsFijiFinlandFragile and conflict affected situationsFranceFrench PolynesiaGabonGambia, TheGeorgiaGermanyGhanaGibraltarGreeceGreenlandGrenadaGuamGuatemalaGuineaGuinea-BissauGuyanaHaitiHeavily indebted poor countries (HIPC)High incomeHondurasHong Kong SAR, ChinaHungaryIBRD onlyIcelandIDA & IBRD totalIDA blendIDA onlyIDA totalIndiaIndonesiaIran, Islamic Rep.IraqIrelandIsraelItalyJamaicaJapanJordanKazakhstanKenyaKiribatiKorea, Dem. People’s Rep.Korea, Rep.KosovoKuwaitKyrgyz RepublicLao PDRLate-demographic dividendLatin America & Caribbean Latin America & Caribbean (excluding high income)Latin America & the Caribbean (IDA & IBRD countries)LatviaLeast developed countries: UN classificationLebanonLiberiaLibyaLithuaniaLow & middle incomeLow incomeLower middle incomeLuxembourgMacao SAR, ChinaMacedonia, FYRMadagascarMalawiMalaysiaMaldivesMaliMaltaMauritaniaMauritiusMexicoMiddle East & North AfricaMiddle East & North Africa (excluding high income)Middle East & North Africa (IDA & IBRD countries)Middle incomeMoldovaMongoliaMontenegroMoroccoMozambiqueMyanmarNauruNepalNetherlandsNew CaledoniaNew ZealandNicaraguaNigerNigeriaNorth AmericaNorwayOECD membersOmanOther small statesPacific island small statesPakistanPanamaPapua New GuineaParaguayPeruPhilippinesPolandPortugalPost-demographic dividendPre-demographic dividendQatarRomaniaRussian FederationRwandaSamoaSao Tome and PrincipeSaudi ArabiaSenegalSerbiaSeychellesSierra LeoneSingaporeSlovak RepublicSloveniaSmall statesSolomon IslandsSomaliaSouth AfricaSouth AsiaSouth Asia (IDA & IBRD)SpainSri LankaSt. Kitts and NevisSt. LuciaSt. Vincent and the GrenadinesSub-Saharan Africa Sub-Saharan Africa (excluding high income)Sub-Saharan Africa (IDA & IBRD countries)SudanSurinameSwedenSwitzerlandSyrian Arab RepublicTajikistanTanzaniaThailandTogoTongaTrinidad and TobagoTunisiaTurkeyTurkmenistanTuvaluUgandaUkraineUnited Arab EmiratesUnited KingdomUnited StatesUpper middle incomeUruguayUzbekistanVanuatuVenezuela, RBVietnamWorldYemen, Rep.ZambiaZimbabwe Timeline:
This timeline shows a graph from 1961 to 2015 of Guinea. No data until 1960. Number of actual observations by date: 36.
Source name:
World Development Indicators
Source organization:
World Bank staff estimates based data from International Monetary Fund's Direction of Trade database.
Categories, topics:
Private Sector, Trade
Last updated:
apr 23, 2017
Indicators value changes by year
At the date of observation
Value
Absolute change
Change from previous value
jan 1, 1961
100.0
+100.0
0.0%
jan 1, 1971
4.972
-95.028
-95.03%
jan 1, 1982
7.598
+2.626
52.81%
jan 1, 1983
5.645
-1.953
-25.7%
jan 1, 1984
5.163
-0.482
-8.54%
jan 1, 1985
6.225
+1.062
20.57%
jan 1, 1986
6.864
+0.638
10.25%
jan 1, 1987
7.475
+0.612
8.91%
jan 1, 1988
13.097
+5.622
75.21%
jan 1, 1989
14.406
+1.309
10.0%
jan 1, 1990
15.691
+1.285
8.92%
jan 1, 1991
16.686
+0.994
6.34%
jan 1, 1992
19.038
+2.352
14.1%
jan 1, 1993
22.501
+3.463
18.19%
jan 1, 1994
17.16
-5.341
-23.74%
jan 1, 1995
35.239
+18.079
105.35%
jan 1, 1996
20.509
-14.731
-41.8%
jan 1, 1997
13.29
-7.218
-35.2%
jan 1, 1998
2.476
-10.814
-81.37%
jan 1, 1999
3.343
+0.867
35.03%
jan 1, 2000
4.166
+0.823
24.61%
jan 1, 2001
0.183
-3.983
-95.62%
jan 1, 2002
0.504
+0.321
175.71%
jan 1, 2003
0.358
-0.145
-28.88%
jan 1, 2004
10.432
+10.074
2.81K%
jan 1, 2005
27.969
+17.537
168.1%
jan 1, 2006
13.387
-14.581
-52.13%
jan 1, 2007
14.205
+0.817
6.11%
jan 1, 2008
12.88
-1.325
-9.33%
jan 1, 2009
16.544
+3.664
28.44%
jan 1, 2010
21.337
+4.793
28.97%
jan 1, 2011
15.49
-5.847
-27.4%
jan 1, 2012
17.64
+2.15
13.88%
jan 1, 2013
22.052
+4.412
25.01%
jan 1, 2014
19.581
-2.47
-11.2%
jan 1, 2015
17.824
-1.757
-8.97%
Ranking of countries by current statistics by years


Comments: