29
/
en
AIzaSyAYiBZKx7MnpbEhh9jyipgxe19OcubqV5w
April 1, 2024
109930
Congo, Dem. Rep.
COD
true
2
1
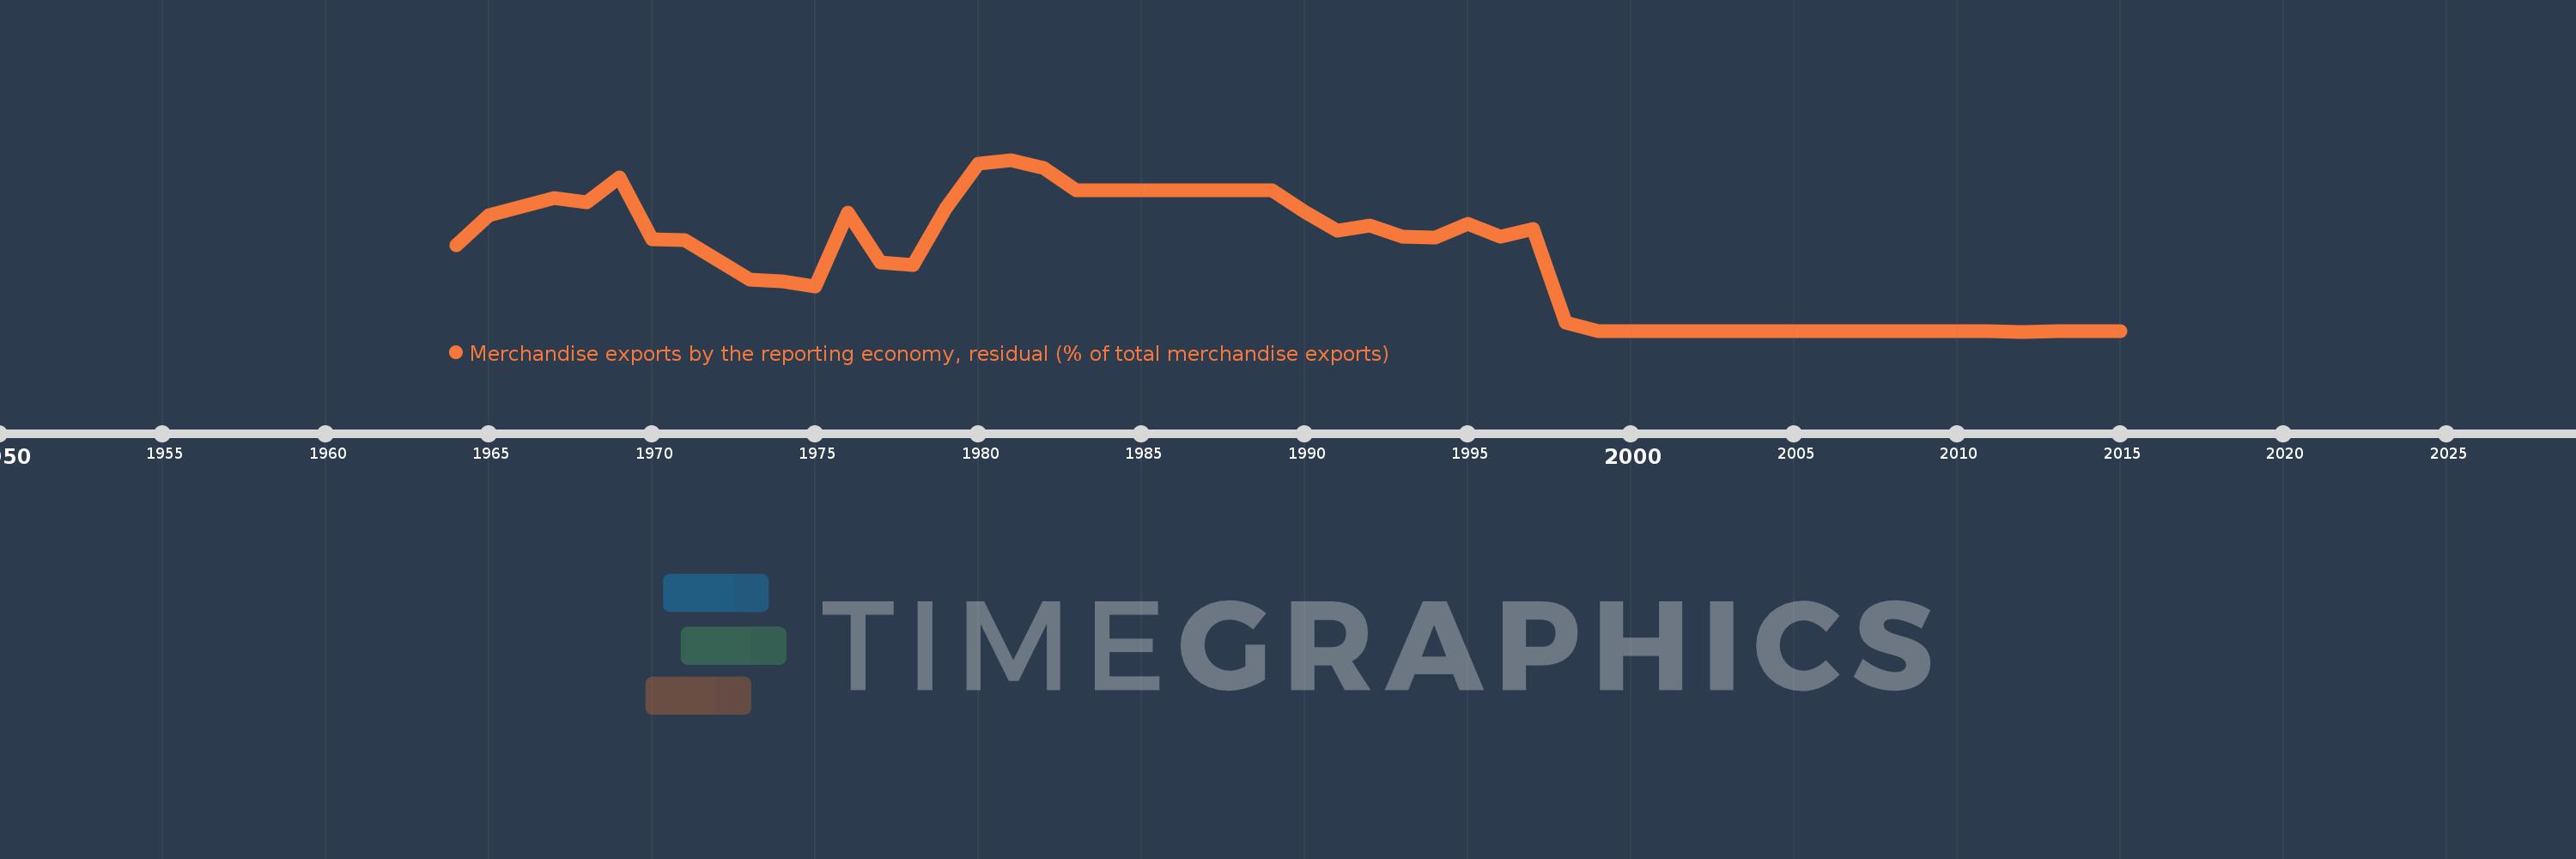
Merchandise exports by the reporting economy, residual (% of total merchandise exports)
2015,2014,2013,2012,2011,2010,2009,2008,2007,2006,2005,2004,2003,2002,2001,2000,1999,1998,1997,1996,1995,1994,1993,1992,1991,1990,1989,1988,1987,1986,1985,1984,1983,1982,1981,1980,1979,1978,1977,1976,1975,1974,1973,1971,1970,1969,1968,1967,1966,1965,1964
This statistics in other country:
AfghanistanAlbaniaAlgeriaAmerican SamoaAngolaAntigua and BarbudaArab WorldArgentinaArmeniaArubaAustraliaAustriaAzerbaijanBahamas, TheBahrainBangladeshBarbadosBelarusBelgiumBelizeBeninBermudaBoliviaBosnia and HerzegovinaBrazilBrunei DarussalamBulgariaBurkina FasoBurundiCabo VerdeCambodiaCameroonCanadaCaribbean small statesCentral African RepublicCentral Europe and the BalticsChadChileChinaColombiaComorosCongo, Dem. Rep.Congo, Rep.Costa RicaCote d'IvoireCroatiaCubaCyprusCzech RepublicDenmarkDjiboutiDominicaDominican RepublicEarly-demographic dividendEast Asia & PacificEast Asia & Pacific (excluding high income)East Asia & Pacific (IDA & IBRD countries)EcuadorEgypt, Arab Rep.El SalvadorEquatorial GuineaEstoniaEthiopiaEuro areaEurope & Central AsiaEurope & Central Asia (excluding high income)Europe & Central Asia (IDA & IBRD countries)European UnionFaroe IslandsFijiFinlandFragile and conflict affected situationsFranceFrench PolynesiaGabonGambia, TheGeorgiaGermanyGhanaGibraltarGreeceGreenlandGrenadaGuamGuatemalaGuineaGuinea-BissauGuyanaHaitiHeavily indebted poor countries (HIPC)High incomeHondurasHong Kong SAR, ChinaHungaryIBRD onlyIcelandIDA & IBRD totalIDA blendIDA onlyIDA totalIndiaIndonesiaIran, Islamic Rep.IraqIrelandIsraelItalyJamaicaJapanJordanKazakhstanKenyaKiribatiKorea, Dem. People’s Rep.Korea, Rep.KosovoKuwaitKyrgyz RepublicLao PDRLate-demographic dividendLatin America & Caribbean Latin America & Caribbean (excluding high income)Latin America & the Caribbean (IDA & IBRD countries)LatviaLeast developed countries: UN classificationLebanonLiberiaLibyaLithuaniaLow & middle incomeLow incomeLower middle incomeLuxembourgMacao SAR, ChinaMacedonia, FYRMadagascarMalawiMalaysiaMaldivesMaliMaltaMauritaniaMauritiusMexicoMiddle East & North AfricaMiddle East & North Africa (excluding high income)Middle East & North Africa (IDA & IBRD countries)Middle incomeMoldovaMongoliaMontenegroMoroccoMozambiqueMyanmarNauruNepalNetherlandsNew CaledoniaNew ZealandNicaraguaNigerNigeriaNorth AmericaNorwayOECD membersOmanOther small statesPacific island small statesPakistanPanamaPapua New GuineaParaguayPeruPhilippinesPolandPortugalPost-demographic dividendPre-demographic dividendQatarRomaniaRussian FederationRwandaSamoaSao Tome and PrincipeSaudi ArabiaSenegalSerbiaSeychellesSierra LeoneSingaporeSlovak RepublicSloveniaSmall statesSolomon IslandsSomaliaSouth AfricaSouth AsiaSouth Asia (IDA & IBRD)SpainSri LankaSt. Kitts and NevisSt. LuciaSt. Vincent and the GrenadinesSub-Saharan Africa Sub-Saharan Africa (excluding high income)Sub-Saharan Africa (IDA & IBRD countries)SudanSurinameSwedenSwitzerlandSyrian Arab RepublicTajikistanTanzaniaThailandTogoTongaTrinidad and TobagoTunisiaTurkeyTurkmenistanTuvaluUgandaUkraineUnited Arab EmiratesUnited KingdomUnited StatesUpper middle incomeUruguayUzbekistanVanuatuVenezuela, RBVietnamWorldYemen, Rep.ZambiaZimbabwe Timeline:
This timeline shows a graph from 1964 to 2015 of Congo, Dem. Rep.. No data until 1963. Number of actual observations by date: 51.
Source name:
World Development Indicators
Source organization:
World Bank staff estimates based data from International Monetary Fund's Direction of Trade database.
Categories, topics:
Private Sector, Trade
Last updated:
apr 23, 2017
Indicators value changes by year
Maximum:
80.196
jan 1, 1981
At the date of observation
Value
Absolute change
Change from previous value
jan 1, 1964
40.239
+40.239
0.0%
jan 1, 1965
54.217
+13.977
34.74%
jan 1, 1966
58.266
+4.05
7.47%
jan 1, 1967
62.321
+4.055
6.96%
jan 1, 1968
60.359
-1.962
-3.15%
jan 1, 1969
71.796
+11.438
18.95%
jan 1, 1970
43.131
-28.666
-39.93%
jan 1, 1971
42.807
-0.324
-0.75%
jan 1, 1973
24.187
-18.62
-43.5%
jan 1, 1974
23.401
-0.785
-3.25%
jan 1, 1975
21.229
-2.172
-9.28%
jan 1, 1976
55.552
+34.322
161.67%
jan 1, 1977
32.357
-23.194
-41.75%
jan 1, 1978
30.958
-1.4
-4.33%
jan 1, 1979
57.765
+26.808
86.59%
jan 1, 1980
78.532
+20.767
35.95%
jan 1, 1981
80.196
+1.664
2.12%
jan 1, 1982
76.503
-3.692
-4.6%
jan 1, 1983
66.006
-10.497
-13.72%
jan 1, 1984
66.006
0.0
0.0%
jan 1, 1985
66.006
+0.0
0.0%
jan 1, 1986
66.006
+0.0
0.0%
jan 1, 1987
66.006
0.0
0.0%
jan 1, 1988
66.006
+0.0
0.0%
jan 1, 1989
66.006
+0.0
0.0%
jan 1, 1990
56.09
-9.917
-15.02%
jan 1, 1991
47.237
-8.853
-15.78%
jan 1, 1992
49.604
+2.367
5.01%
jan 1, 1993
44.512
-5.092
-10.27%
jan 1, 1994
43.82
-0.692
-1.56%
jan 1, 1995
50.529
+6.709
15.31%
jan 1, 1996
44.175
-6.354
-12.58%
jan 1, 1997
47.901
+3.726
8.44%
jan 1, 1998
4.149
-43.752
-91.34%
jan 1, 1999
0.25
-3.899
-93.97%
jan 1, 2000
0.247
-0.003
-1.27%
jan 1, 2001
0.254
+0.007
2.95%
jan 1, 2002
0.268
+0.013
5.31%
jan 1, 2003
0.239
-0.029
-10.74%
jan 1, 2004
0.356
+0.117
49.11%
jan 1, 2005
0.34
-0.017
-4.67%
jan 1, 2006
0.294
-0.046
-13.43%
jan 1, 2007
0.302
+0.008
2.81%
jan 1, 2008
0.263
-0.04
-13.12%
jan 1, 2009
0.153
-0.11
-41.77%
jan 1, 2010
0.205
+0.052
33.79%
jan 1, 2011
0.12
-0.085
-41.59%
jan 1, 2012
0.102
-0.018
-14.77%
jan 1, 2013
0.11
+0.009
8.4%
jan 1, 2014
0.11
0.0
-0.24%
jan 1, 2015
0.108
-0.002
-1.7%
Ranking of countries by current statistics by years


Comments: