29
/
en
AIzaSyAYiBZKx7MnpbEhh9jyipgxe19OcubqV5w
April 1, 2024
236041
Senegal
SEN
true
2
1
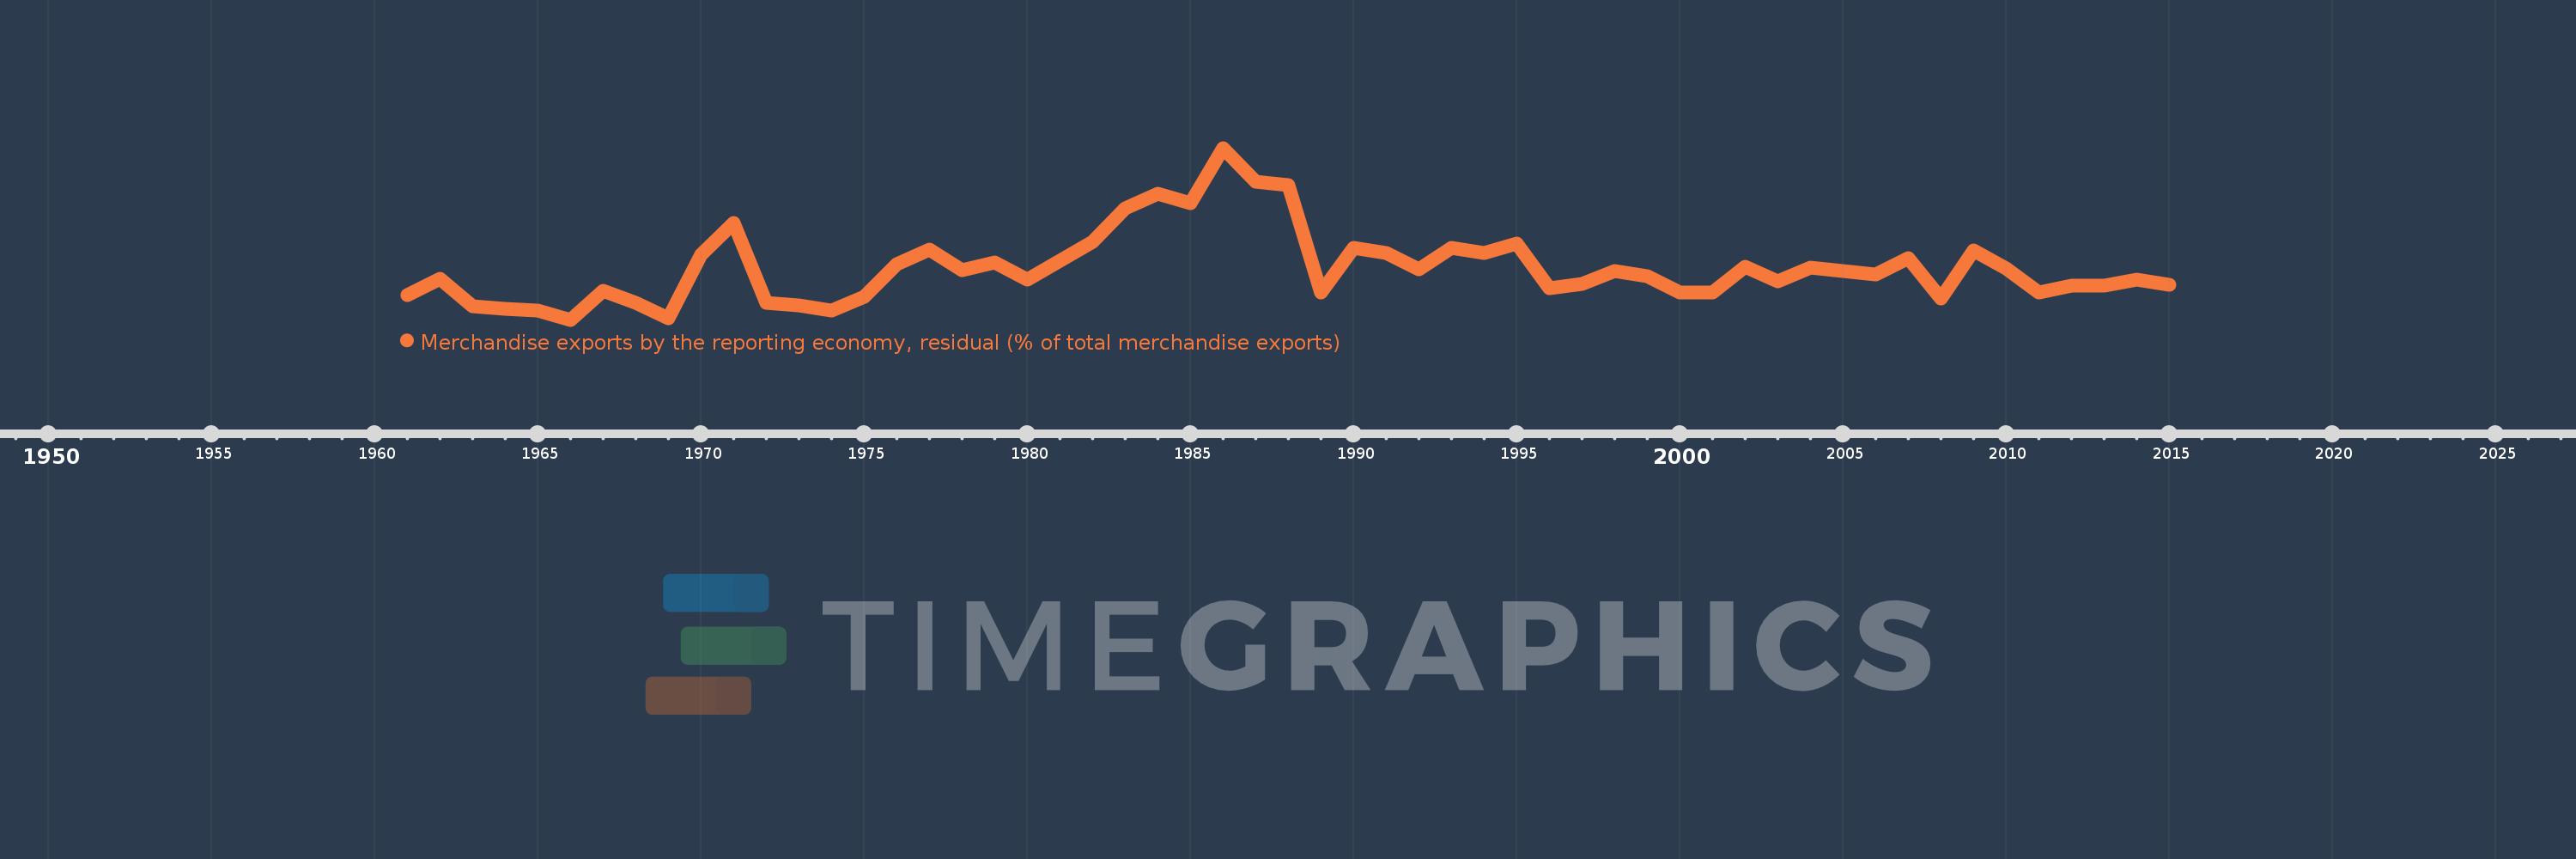
Merchandise exports by the reporting economy, residual (% of total merchandise exports)
2015,2014,2013,2012,2011,2010,2009,2008,2007,2006,2005,2004,2003,2002,2001,2000,1999,1998,1997,1996,1995,1994,1993,1992,1991,1990,1989,1988,1987,1986,1985,1984,1983,1982,1981,1980,1979,1978,1977,1976,1975,1974,1973,1972,1971,1970,1969,1968,1967,1966,1965,1964,1963,1962,1961
This statistics in other country:
AfghanistanAlbaniaAlgeriaAmerican SamoaAngolaAntigua and BarbudaArab WorldArgentinaArmeniaArubaAustraliaAustriaAzerbaijanBahamas, TheBahrainBangladeshBarbadosBelarusBelgiumBelizeBeninBermudaBoliviaBosnia and HerzegovinaBrazilBrunei DarussalamBulgariaBurkina FasoBurundiCabo VerdeCambodiaCameroonCanadaCaribbean small statesCentral African RepublicCentral Europe and the BalticsChadChileChinaColombiaComorosCongo, Dem. Rep.Congo, Rep.Costa RicaCote d'IvoireCroatiaCubaCyprusCzech RepublicDenmarkDjiboutiDominicaDominican RepublicEarly-demographic dividendEast Asia & PacificEast Asia & Pacific (excluding high income)East Asia & Pacific (IDA & IBRD countries)EcuadorEgypt, Arab Rep.El SalvadorEquatorial GuineaEstoniaEthiopiaEuro areaEurope & Central AsiaEurope & Central Asia (excluding high income)Europe & Central Asia (IDA & IBRD countries)European UnionFaroe IslandsFijiFinlandFragile and conflict affected situationsFranceFrench PolynesiaGabonGambia, TheGeorgiaGermanyGhanaGibraltarGreeceGreenlandGrenadaGuamGuatemalaGuineaGuinea-BissauGuyanaHaitiHeavily indebted poor countries (HIPC)High incomeHondurasHong Kong SAR, ChinaHungaryIBRD onlyIcelandIDA & IBRD totalIDA blendIDA onlyIDA totalIndiaIndonesiaIran, Islamic Rep.IraqIrelandIsraelItalyJamaicaJapanJordanKazakhstanKenyaKiribatiKorea, Dem. People’s Rep.Korea, Rep.KosovoKuwaitKyrgyz RepublicLao PDRLate-demographic dividendLatin America & Caribbean Latin America & Caribbean (excluding high income)Latin America & the Caribbean (IDA & IBRD countries)LatviaLeast developed countries: UN classificationLebanonLiberiaLibyaLithuaniaLow & middle incomeLow incomeLower middle incomeLuxembourgMacao SAR, ChinaMacedonia, FYRMadagascarMalawiMalaysiaMaldivesMaliMaltaMauritaniaMauritiusMexicoMiddle East & North AfricaMiddle East & North Africa (excluding high income)Middle East & North Africa (IDA & IBRD countries)Middle incomeMoldovaMongoliaMontenegroMoroccoMozambiqueMyanmarNauruNepalNetherlandsNew CaledoniaNew ZealandNicaraguaNigerNigeriaNorth AmericaNorwayOECD membersOmanOther small statesPacific island small statesPakistanPanamaPapua New GuineaParaguayPeruPhilippinesPolandPortugalPost-demographic dividendPre-demographic dividendQatarRomaniaRussian FederationRwandaSamoaSao Tome and PrincipeSaudi ArabiaSenegalSerbiaSeychellesSierra LeoneSingaporeSlovak RepublicSloveniaSmall statesSolomon IslandsSomaliaSouth AfricaSouth AsiaSouth Asia (IDA & IBRD)SpainSri LankaSt. Kitts and NevisSt. LuciaSt. Vincent and the GrenadinesSub-Saharan Africa Sub-Saharan Africa (excluding high income)Sub-Saharan Africa (IDA & IBRD countries)SudanSurinameSwedenSwitzerlandSyrian Arab RepublicTajikistanTanzaniaThailandTogoTongaTrinidad and TobagoTunisiaTurkeyTurkmenistanTuvaluUgandaUkraineUnited Arab EmiratesUnited KingdomUnited StatesUpper middle incomeUruguayUzbekistanVanuatuVenezuela, RBVietnamWorldYemen, Rep.ZambiaZimbabwe Timeline:
This timeline shows a graph from 1961 to 2015 of Senegal. No data until 1960. Number of actual observations by date: 55.
Source name:
World Development Indicators
Source organization:
World Bank staff estimates based data from International Monetary Fund's Direction of Trade database.
Categories, topics:
Private Sector, Trade
Last updated:
apr 23, 2017
Indicators value changes by year
Maximum:
43.916
jan 1, 1986
At the date of observation
Value
Absolute change
Change from previous value
jan 1, 1961
7.348
+7.348
0.0%
jan 1, 1962
11.325
+3.978
54.13%
jan 1, 1963
4.696
-6.629
-58.53%
jan 1, 1964
3.902
-0.794
-16.91%
jan 1, 1965
3.548
-0.354
-9.08%
jan 1, 1966
1.256
-2.292
-64.6%
jan 1, 1967
8.529
+7.273
579.14%
jan 1, 1968
5.496
-3.033
-35.56%
jan 1, 1969
1.662
-3.834
-69.76%
jan 1, 1970
17.37
+15.708
944.98%
jan 1, 1971
25.272
+7.902
45.49%
jan 1, 1972
5.386
-19.886
-78.69%
jan 1, 1973
4.924
-0.462
-8.57%
jan 1, 1974
3.433
-1.491
-30.28%
jan 1, 1975
7.034
+3.601
104.9%
jan 1, 1976
15.163
+8.129
115.56%
jan 1, 1977
18.698
+3.535
23.31%
jan 1, 1978
13.461
-5.238
-28.01%
jan 1, 1979
15.501
+2.04
15.15%
jan 1, 1980
11.301
-4.2
-27.1%
jan 1, 1981
15.81
+4.509
39.9%
jan 1, 1982
20.667
+4.857
30.72%
jan 1, 1983
28.847
+8.18
39.58%
jan 1, 1984
32.636
+3.789
13.13%
jan 1, 1985
30.171
-2.464
-7.55%
jan 1, 1986
43.916
+13.745
45.56%
jan 1, 1987
35.52
-8.396
-19.12%
jan 1, 1988
34.687
-0.833
-2.35%
jan 1, 1989
8.087
-26.6
-76.69%
jan 1, 1990
19.116
+11.029
136.38%
jan 1, 1991
17.923
-1.193
-6.24%
jan 1, 1992
13.681
-4.242
-23.67%
jan 1, 1993
19.033
+5.352
39.12%
jan 1, 1994
17.851
-1.182
-6.21%
jan 1, 1995
20.236
+2.386
13.36%
jan 1, 1996
9.152
-11.085
-54.78%
jan 1, 1997
10.249
+1.098
12.0%
jan 1, 1998
13.318
+3.068
29.94%
jan 1, 1999
11.976
-1.342
-10.08%
jan 1, 2000
7.929
-4.046
-33.79%
jan 1, 2001
8.049
+0.119
1.51%
jan 1, 2002
14.374
+6.325
78.59%
jan 1, 2003
10.818
-3.557
-24.74%
jan 1, 2004
14.169
+3.351
30.97%
jan 1, 2005
13.398
-0.77
-5.44%
jan 1, 2006
12.466
-0.932
-6.95%
jan 1, 2007
16.564
+4.097
32.87%
jan 1, 2008
6.479
-10.085
-60.89%
jan 1, 2009
18.443
+11.964
184.67%
jan 1, 2010
13.989
-4.454
-24.15%
jan 1, 2011
8.061
-5.928
-42.38%
jan 1, 2012
9.662
+1.601
19.86%
jan 1, 2013
9.694
+0.032
0.33%
jan 1, 2014
11.211
+1.517
15.65%
jan 1, 2015
9.92
-1.29
-11.51%
Ranking of countries by current statistics by years


Comments: