29
/
en
AIzaSyAYiBZKx7MnpbEhh9jyipgxe19OcubqV5w
April 1, 2024
60523
Sub-Saharan Africa (IDA & IBRD countries)
TSS
false
2
1
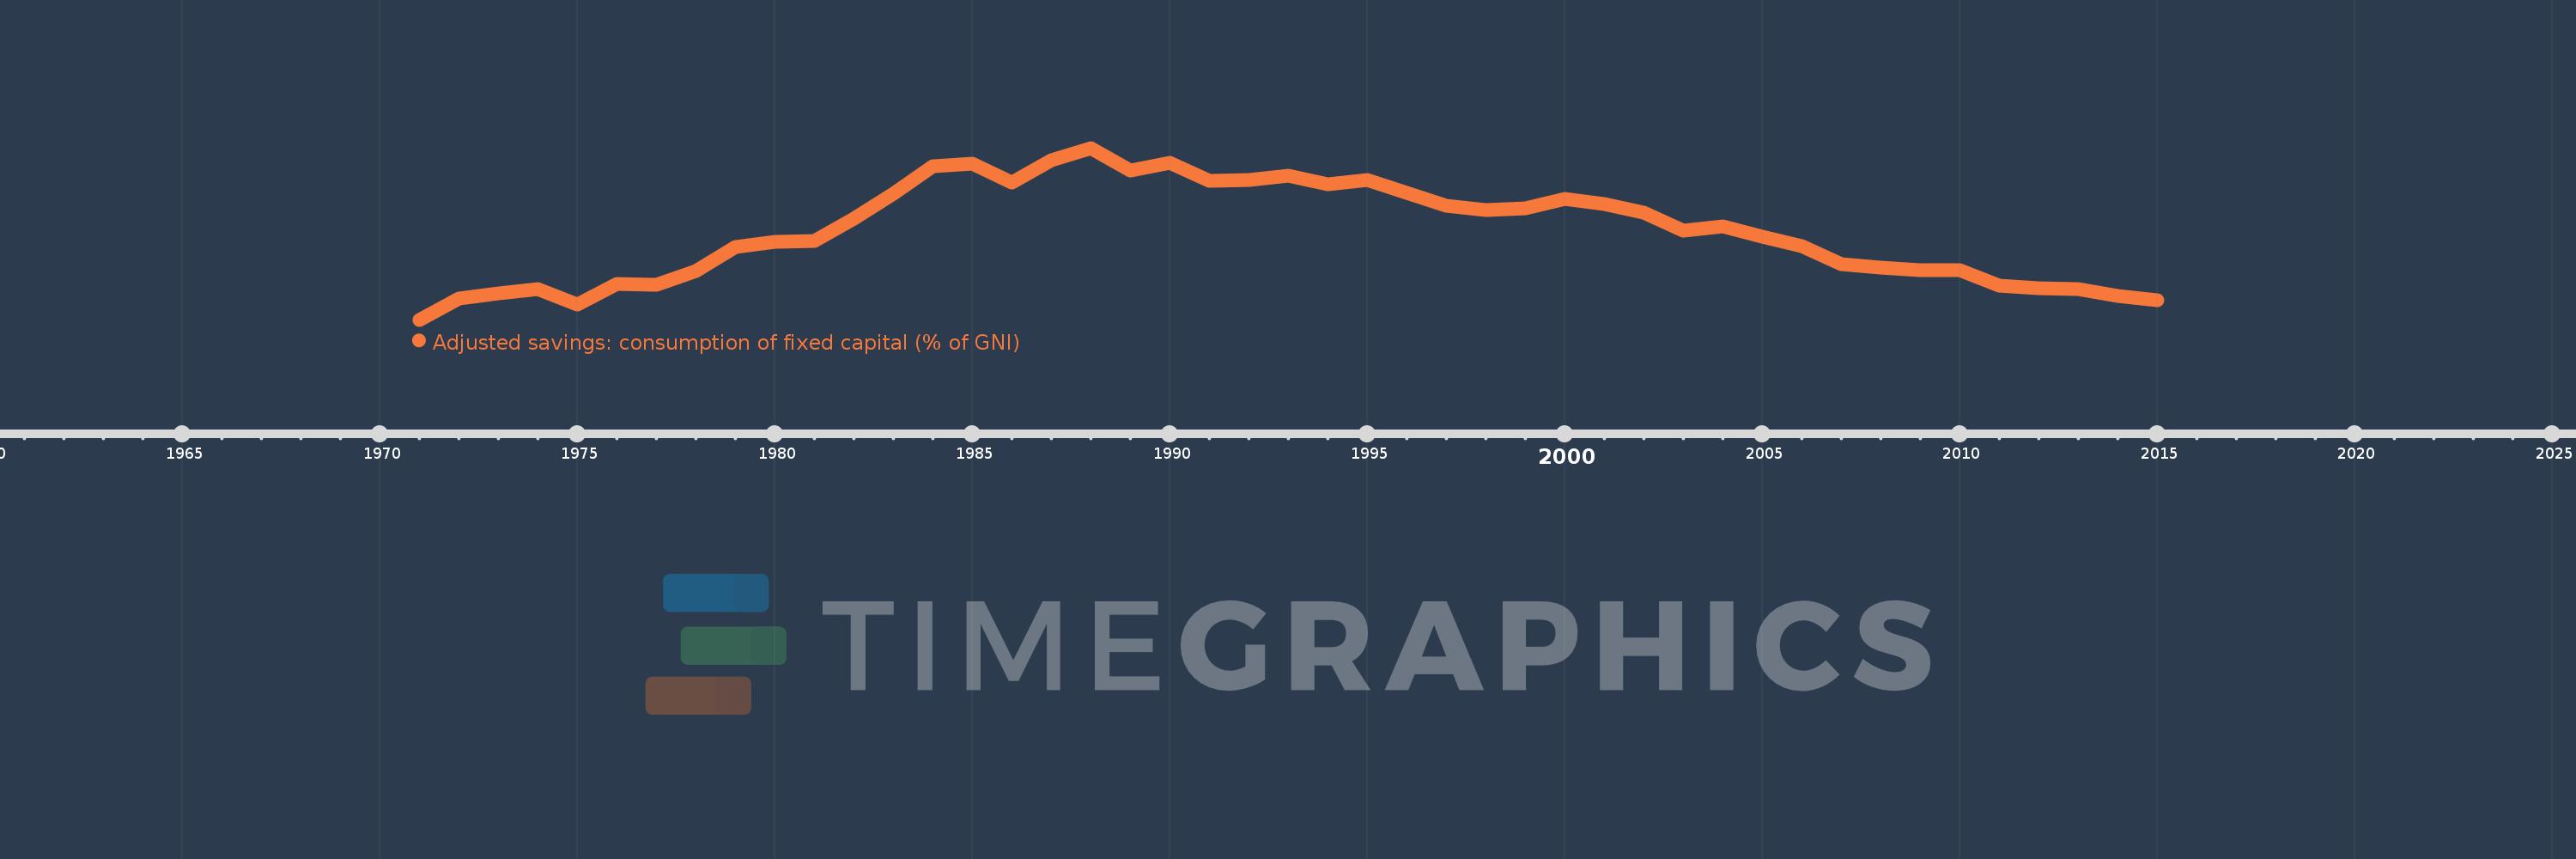
Adjusted savings: consumption of fixed capital (% of GNI)
2015,2014,2013,2012,2011,2010,2009,2008,2007,2006,2005,2004,2003,2002,2001,2000,1999,1998,1997,1996,1995,1994,1993,1992,1991,1990,1989,1988,1987,1986,1985,1984,1983,1982,1981,1980,1979,1978,1977,1976,1975,1974,1973,1972,1971
This statistics in other country:
AfghanistanAlbaniaAlgeriaAndorraAngolaAntigua and BarbudaArab WorldArgentinaArmeniaAustraliaAustriaAzerbaijanBahamas, TheBahrainBangladeshBarbadosBelarusBelgiumBelizeBeninBermudaBhutanBoliviaBosnia and HerzegovinaBotswanaBrazilBrunei DarussalamBulgariaBurkina FasoBurundiCabo VerdeCambodiaCameroonCanadaCaribbean small statesCentral African RepublicCentral Europe and the BalticsChadChileChinaColombiaComorosCongo, Dem. Rep.Congo, Rep.Costa RicaCote d'IvoireCroatiaCubaCyprusCzech RepublicDenmarkDjiboutiDominicaDominican RepublicEarly-demographic dividendEast Asia & PacificEast Asia & Pacific (excluding high income)East Asia & Pacific (IDA & IBRD countries)EcuadorEgypt, Arab Rep.El SalvadorEquatorial GuineaEritreaEstoniaEthiopiaEuro areaEurope & Central AsiaEurope & Central Asia (excluding high income)Europe & Central Asia (IDA & IBRD countries)European UnionFijiFinlandFragile and conflict affected situationsFranceGabonGambia, TheGeorgiaGermanyGhanaGreeceGreenlandGrenadaGuatemalaGuineaGuinea-BissauGuyanaHaitiHeavily indebted poor countries (HIPC)High incomeHondurasHong Kong SAR, ChinaHungaryIBRD onlyIcelandIDA & IBRD totalIDA blendIDA onlyIDA totalIndiaIndonesiaIran, Islamic Rep.IraqIrelandIsraelItalyJamaicaJapanJordanKazakhstanKenyaKiribatiKorea, Rep.KosovoKuwaitKyrgyz RepublicLao PDRLate-demographic dividendLatin America & Caribbean Latin America & Caribbean (excluding high income)Latin America & the Caribbean (IDA & IBRD countries)LatviaLeast developed countries: UN classificationLebanonLesothoLiberiaLibyaLiechtensteinLithuaniaLow & middle incomeLow incomeLower middle incomeLuxembourgMacao SAR, ChinaMacedonia, FYRMadagascarMalawiMalaysiaMaldivesMaliMaltaMarshall IslandsMauritaniaMauritiusMexicoMicronesia, Fed. Sts.Middle East & North AfricaMiddle East & North Africa (excluding high income)Middle East & North Africa (IDA & IBRD countries)Middle incomeMoldovaMonacoMongoliaMontenegroMoroccoMozambiqueMyanmarNamibiaNepalNetherlandsNew ZealandNicaraguaNigerNigeriaNorth AmericaNorwayOECD membersOmanOther small statesPacific island small statesPakistanPalauPanamaPapua New GuineaParaguayPeruPhilippinesPolandPortugalPost-demographic dividendPre-demographic dividendPuerto RicoQatarRomaniaRussian FederationRwandaSamoaSan MarinoSao Tome and PrincipeSaudi ArabiaSenegalSerbiaSeychellesSierra LeoneSingaporeSlovak RepublicSloveniaSmall statesSolomon IslandsSouth AfricaSouth AsiaSouth Asia (IDA & IBRD)SpainSri LankaSt. Kitts and NevisSt. LuciaSt. Vincent and the GrenadinesSub-Saharan Africa Sub-Saharan Africa (excluding high income)Sub-Saharan Africa (IDA & IBRD countries)SudanSurinameSwazilandSwedenSwitzerlandSyrian Arab RepublicTajikistanTanzaniaThailandTimor-LesteTogoTongaTrinidad and TobagoTunisiaTurkeyTurkmenistanTuvaluUgandaUkraineUnited Arab EmiratesUnited KingdomUnited StatesUpper middle incomeUruguayUzbekistanVanuatuVenezuela, RBVietnamWest Bank and GazaWorldYemen, Rep.ZambiaZimbabwe Timeline:
This timeline shows a graph from 1971 to 2015 of Sub-Saharan Africa (IDA & IBRD countries). No data until 1970. Number of actual observations by date: 45.
Source name:
World Development Indicators
Source organization:
World Bank staff estimates using data from the United Nations Statistics Division's National Accounts Statistics.
Categories, topics:
Economy & Growth, Environment
Last updated:
apr 23, 2017
Indicators value changes by year
Maximum:
12.794
jan 1, 1988
At the date of observation
Value
Absolute change
Change from previous value
jan 1, 1971
7.375
+7.375
0.0%
jan 1, 1972
8.051
+0.676
9.16%
jan 1, 1973
8.217
+0.166
2.06%
jan 1, 1974
8.346
+0.129
1.57%
jan 1, 1975
7.853
-0.493
-5.91%
jan 1, 1976
8.514
+0.661
8.42%
jan 1, 1977
8.479
-0.035
-0.41%
jan 1, 1978
8.921
+0.442
5.21%
jan 1, 1979
9.681
+0.761
8.53%
jan 1, 1980
9.829
+0.147
1.52%
jan 1, 1981
9.865
+0.036
0.37%
jan 1, 1982
10.574
+0.709
7.19%
jan 1, 1983
11.36
+0.786
7.43%
jan 1, 1984
12.221
+0.861
7.58%
jan 1, 1985
12.307
+0.086
0.7%
jan 1, 1986
11.706
-0.601
-4.88%
jan 1, 1987
12.418
+0.712
6.08%
jan 1, 1988
12.794
+0.376
3.02%
jan 1, 1989
12.08
-0.714
-5.58%
jan 1, 1990
12.328
+0.248
2.05%
jan 1, 1991
11.754
-0.574
-4.66%
jan 1, 1992
11.777
+0.023
0.2%
jan 1, 1993
11.912
+0.136
1.15%
jan 1, 1994
11.654
-0.258
-2.17%
jan 1, 1995
11.778
+0.124
1.06%
jan 1, 1996
11.377
-0.401
-3.4%
jan 1, 1997
10.962
-0.415
-3.65%
jan 1, 1998
10.839
-0.124
-1.13%
jan 1, 1999
10.888
+0.05
0.46%
jan 1, 2000
11.191
+0.303
2.78%
jan 1, 2001
11.029
-0.162
-1.45%
jan 1, 2002
10.744
-0.286
-2.59%
jan 1, 2003
10.188
-0.556
-5.17%
jan 1, 2004
10.323
+0.135
1.32%
jan 1, 2005
10.003
-0.32
-3.1%
jan 1, 2006
9.686
-0.317
-3.17%
jan 1, 2007
9.124
-0.561
-5.8%
jan 1, 2008
9.025
-0.099
-1.09%
jan 1, 2009
8.935
-0.09
-1.0%
jan 1, 2010
8.951
+0.017
0.19%
jan 1, 2011
8.462
-0.489
-5.46%
jan 1, 2012
8.38
-0.082
-0.97%
jan 1, 2013
8.345
-0.035
-0.42%
jan 1, 2014
8.119
-0.226
-2.71%
jan 1, 2015
7.985
-0.134
-1.65%
Ranking of countries by current statistics by years


Comments: