29
/
en
AIzaSyAYiBZKx7MnpbEhh9jyipgxe19OcubqV5w
April 1, 2024
84950
Bermuda
BMU
true
2
1
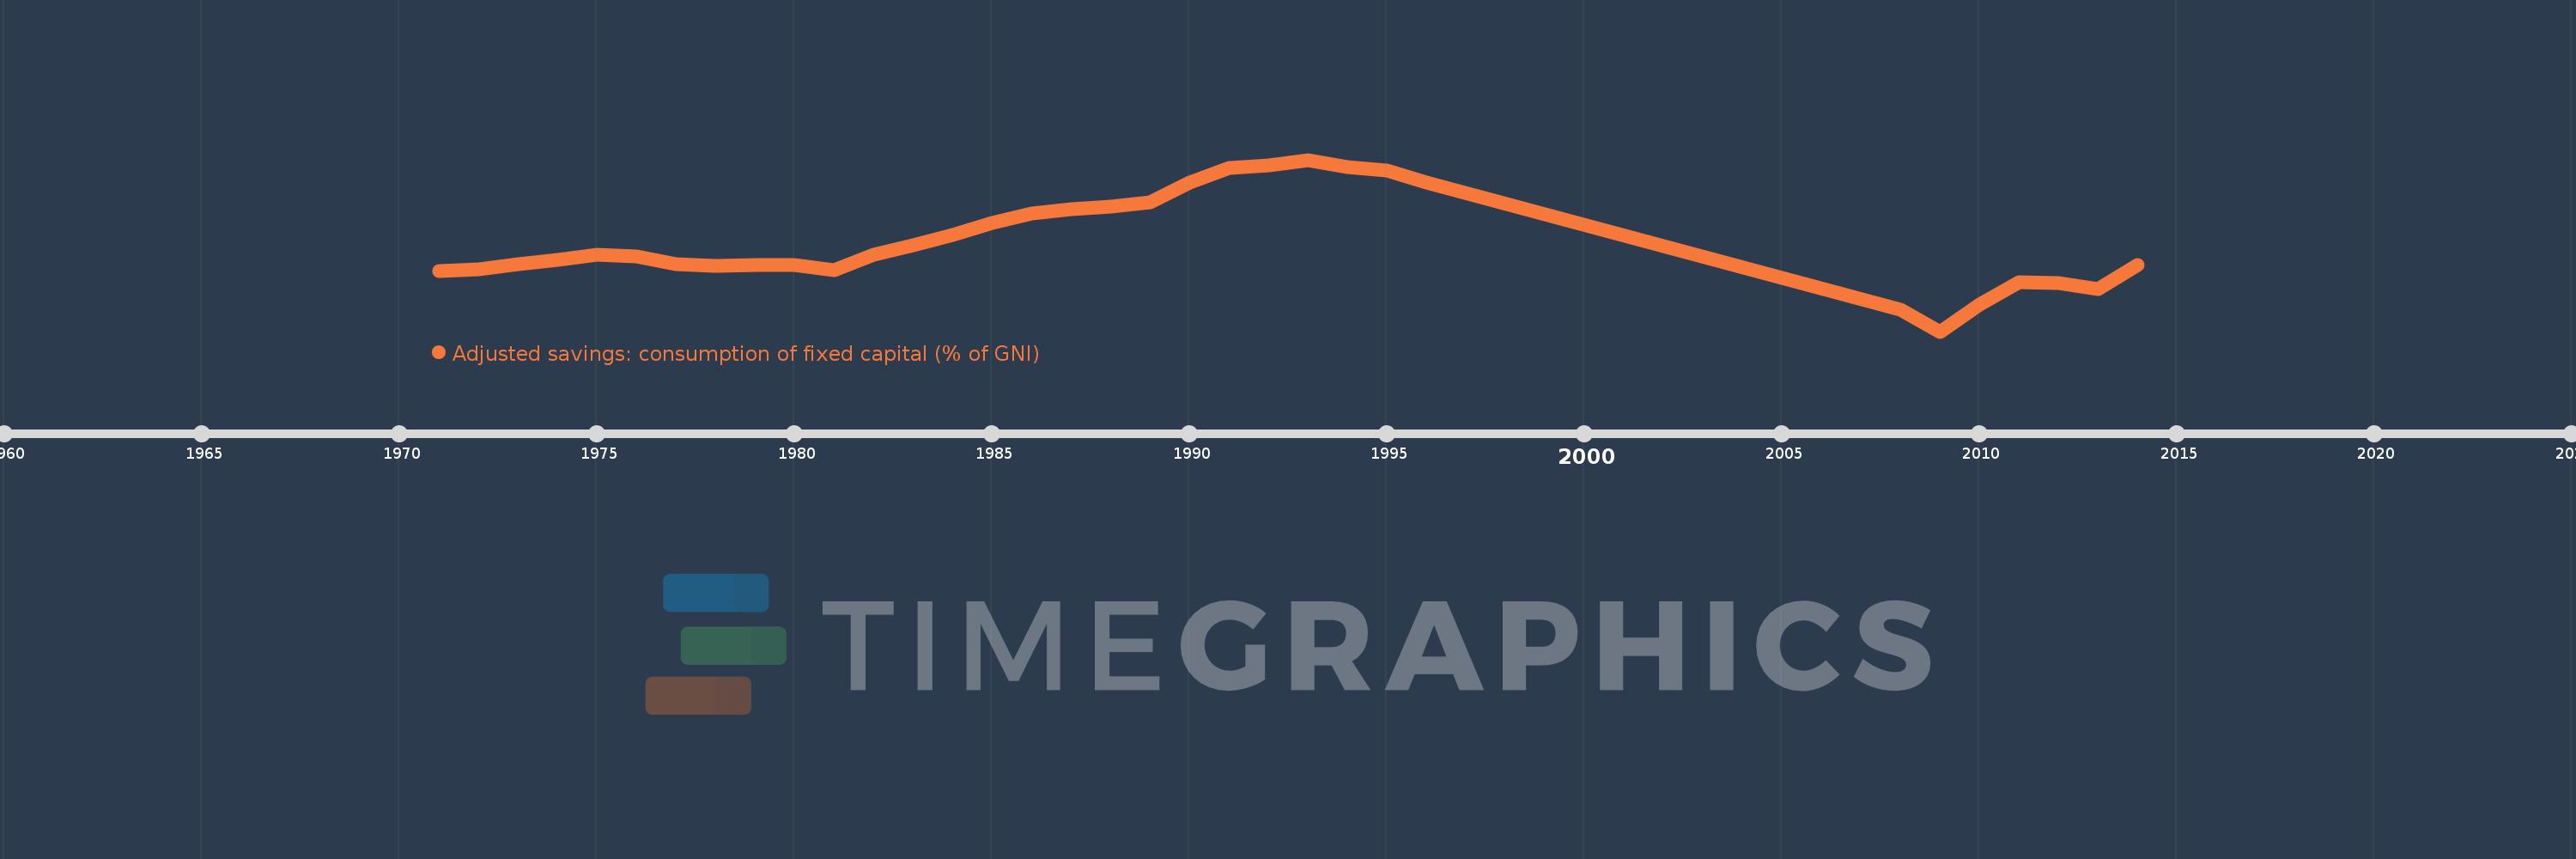
Adjusted savings: consumption of fixed capital (% of GNI)
2014,2013,2012,2011,2010,2009,2008,1996,1995,1994,1993,1992,1991,1990,1989,1988,1987,1986,1985,1984,1983,1982,1981,1980,1979,1978,1977,1976,1975,1974,1973,1972,1971
This statistics in other country:
AfghanistanAlbaniaAlgeriaAndorraAngolaAntigua and BarbudaArab WorldArgentinaArmeniaAustraliaAustriaAzerbaijanBahamas, TheBahrainBangladeshBarbadosBelarusBelgiumBelizeBeninBermudaBhutanBoliviaBosnia and HerzegovinaBotswanaBrazilBrunei DarussalamBulgariaBurkina FasoBurundiCabo VerdeCambodiaCameroonCanadaCaribbean small statesCentral African RepublicCentral Europe and the BalticsChadChileChinaColombiaComorosCongo, Dem. Rep.Congo, Rep.Costa RicaCote d'IvoireCroatiaCubaCyprusCzech RepublicDenmarkDjiboutiDominicaDominican RepublicEarly-demographic dividendEast Asia & PacificEast Asia & Pacific (excluding high income)East Asia & Pacific (IDA & IBRD countries)EcuadorEgypt, Arab Rep.El SalvadorEquatorial GuineaEritreaEstoniaEthiopiaEuro areaEurope & Central AsiaEurope & Central Asia (excluding high income)Europe & Central Asia (IDA & IBRD countries)European UnionFijiFinlandFragile and conflict affected situationsFranceGabonGambia, TheGeorgiaGermanyGhanaGreeceGreenlandGrenadaGuatemalaGuineaGuinea-BissauGuyanaHaitiHeavily indebted poor countries (HIPC)High incomeHondurasHong Kong SAR, ChinaHungaryIBRD onlyIcelandIDA & IBRD totalIDA blendIDA onlyIDA totalIndiaIndonesiaIran, Islamic Rep.IraqIrelandIsraelItalyJamaicaJapanJordanKazakhstanKenyaKiribatiKorea, Rep.KosovoKuwaitKyrgyz RepublicLao PDRLate-demographic dividendLatin America & Caribbean Latin America & Caribbean (excluding high income)Latin America & the Caribbean (IDA & IBRD countries)LatviaLeast developed countries: UN classificationLebanonLesothoLiberiaLibyaLiechtensteinLithuaniaLow & middle incomeLow incomeLower middle incomeLuxembourgMacao SAR, ChinaMacedonia, FYRMadagascarMalawiMalaysiaMaldivesMaliMaltaMarshall IslandsMauritaniaMauritiusMexicoMicronesia, Fed. Sts.Middle East & North AfricaMiddle East & North Africa (excluding high income)Middle East & North Africa (IDA & IBRD countries)Middle incomeMoldovaMonacoMongoliaMontenegroMoroccoMozambiqueMyanmarNamibiaNepalNetherlandsNew ZealandNicaraguaNigerNigeriaNorth AmericaNorwayOECD membersOmanOther small statesPacific island small statesPakistanPalauPanamaPapua New GuineaParaguayPeruPhilippinesPolandPortugalPost-demographic dividendPre-demographic dividendPuerto RicoQatarRomaniaRussian FederationRwandaSamoaSan MarinoSao Tome and PrincipeSaudi ArabiaSenegalSerbiaSeychellesSierra LeoneSingaporeSlovak RepublicSloveniaSmall statesSolomon IslandsSouth AfricaSouth AsiaSouth Asia (IDA & IBRD)SpainSri LankaSt. Kitts and NevisSt. LuciaSt. Vincent and the GrenadinesSub-Saharan Africa Sub-Saharan Africa (excluding high income)Sub-Saharan Africa (IDA & IBRD countries)SudanSurinameSwazilandSwedenSwitzerlandSyrian Arab RepublicTajikistanTanzaniaThailandTimor-LesteTogoTongaTrinidad and TobagoTunisiaTurkeyTurkmenistanTuvaluUgandaUkraineUnited Arab EmiratesUnited KingdomUnited StatesUpper middle incomeUruguayUzbekistanVanuatuVenezuela, RBVietnamWest Bank and GazaWorldYemen, Rep.ZambiaZimbabwe Timeline:
This timeline shows a graph from 1971 to 2014 of Bermuda. No data until 1970. Number of actual observations by date: 33.
Source name:
World Development Indicators
Source organization:
World Bank staff estimates using data from the United Nations Statistics Division's National Accounts Statistics.
Categories, topics:
Economy & Growth, Environment
Last updated:
apr 23, 2017
Indicators value changes by year
At the date of observation
Value
Absolute change
Change from previous value
jan 1, 1971
5.167
+5.167
0.0%
jan 1, 1972
5.202
+0.034
0.66%
jan 1, 1973
5.364
+0.163
3.13%
jan 1, 1974
5.484
+0.12
2.24%
jan 1, 1975
5.618
+0.133
2.43%
jan 1, 1976
5.586
-0.031
-0.56%
jan 1, 1977
5.366
-0.22
-3.93%
jan 1, 1978
5.316
-0.051
-0.95%
jan 1, 1979
5.336
+0.021
0.39%
jan 1, 1980
5.332
-0.004
-0.08%
jan 1, 1981
5.186
-0.145
-2.72%
jan 1, 1982
5.628
+0.442
8.52%
jan 1, 1983
5.909
+0.281
4.99%
jan 1, 1984
6.194
+0.285
4.82%
jan 1, 1985
6.554
+0.36
5.82%
jan 1, 1986
6.812
+0.257
3.93%
jan 1, 1987
6.947
+0.136
1.99%
jan 1, 1988
7.015
+0.067
0.97%
jan 1, 1989
7.153
+0.139
1.98%
jan 1, 1990
7.707
+0.553
7.74%
jan 1, 1991
8.128
+0.421
5.47%
jan 1, 1992
8.209
+0.081
0.99%
jan 1, 1993
8.372
+0.163
1.98%
jan 1, 1994
8.156
-0.216
-2.58%
jan 1, 1995
8.059
-0.096
-1.18%
jan 1, 1996
7.704
-0.355
-4.41%
jan 1, 2008
4.033
-3.671
-47.65%
jan 1, 2009
3.408
-0.625
-15.49%
jan 1, 2010
4.179
+0.77
22.61%
jan 1, 2011
4.838
+0.659
15.77%
jan 1, 2012
4.818
-0.019
-0.4%
jan 1, 2013
4.645
-0.173
-3.6%
jan 1, 2014
5.321
+0.676
14.56%
Ranking of countries by current statistics by years


Comments: