29
/
en
AIzaSyAYiBZKx7MnpbEhh9jyipgxe19OcubqV5w
April 1, 2024
96982
Cabo Verde
CPV
true
2
1
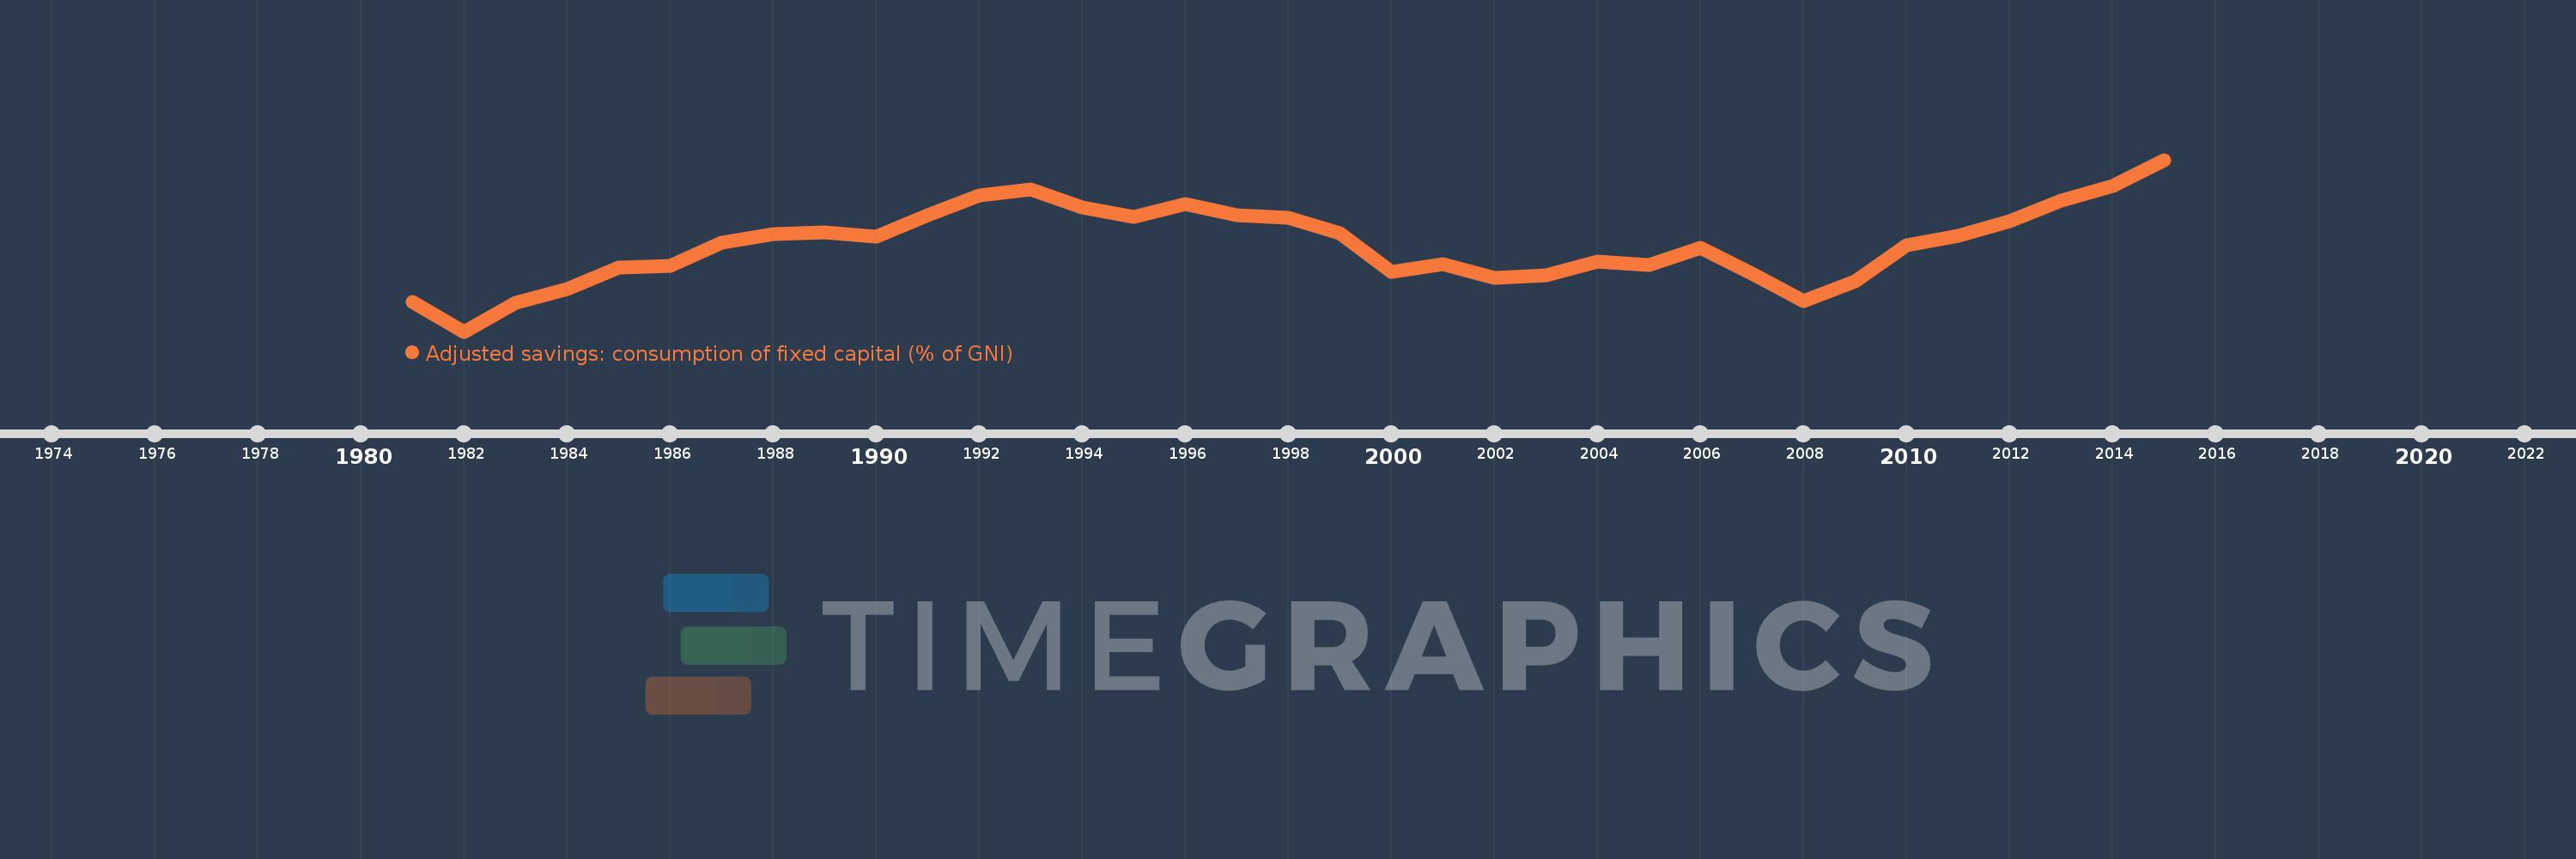
Adjusted savings: consumption of fixed capital (% of GNI)
2015,2014,2013,2012,2011,2010,2009,2008,2007,2006,2005,2004,2003,2002,2001,2000,1999,1998,1997,1996,1995,1994,1993,1992,1991,1990,1989,1988,1987,1986,1985,1984,1983,1982,1981
This statistics in other country:
AfghanistanAlbaniaAlgeriaAndorraAngolaAntigua and BarbudaArab WorldArgentinaArmeniaAustraliaAustriaAzerbaijanBahamas, TheBahrainBangladeshBarbadosBelarusBelgiumBelizeBeninBermudaBhutanBoliviaBosnia and HerzegovinaBotswanaBrazilBrunei DarussalamBulgariaBurkina FasoBurundiCabo VerdeCambodiaCameroonCanadaCaribbean small statesCentral African RepublicCentral Europe and the BalticsChadChileChinaColombiaComorosCongo, Dem. Rep.Congo, Rep.Costa RicaCote d'IvoireCroatiaCubaCyprusCzech RepublicDenmarkDjiboutiDominicaDominican RepublicEarly-demographic dividendEast Asia & PacificEast Asia & Pacific (excluding high income)East Asia & Pacific (IDA & IBRD countries)EcuadorEgypt, Arab Rep.El SalvadorEquatorial GuineaEritreaEstoniaEthiopiaEuro areaEurope & Central AsiaEurope & Central Asia (excluding high income)Europe & Central Asia (IDA & IBRD countries)European UnionFijiFinlandFragile and conflict affected situationsFranceGabonGambia, TheGeorgiaGermanyGhanaGreeceGreenlandGrenadaGuatemalaGuineaGuinea-BissauGuyanaHaitiHeavily indebted poor countries (HIPC)High incomeHondurasHong Kong SAR, ChinaHungaryIBRD onlyIcelandIDA & IBRD totalIDA blendIDA onlyIDA totalIndiaIndonesiaIran, Islamic Rep.IraqIrelandIsraelItalyJamaicaJapanJordanKazakhstanKenyaKiribatiKorea, Rep.KosovoKuwaitKyrgyz RepublicLao PDRLate-demographic dividendLatin America & Caribbean Latin America & Caribbean (excluding high income)Latin America & the Caribbean (IDA & IBRD countries)LatviaLeast developed countries: UN classificationLebanonLesothoLiberiaLibyaLiechtensteinLithuaniaLow & middle incomeLow incomeLower middle incomeLuxembourgMacao SAR, ChinaMacedonia, FYRMadagascarMalawiMalaysiaMaldivesMaliMaltaMarshall IslandsMauritaniaMauritiusMexicoMicronesia, Fed. Sts.Middle East & North AfricaMiddle East & North Africa (excluding high income)Middle East & North Africa (IDA & IBRD countries)Middle incomeMoldovaMonacoMongoliaMontenegroMoroccoMozambiqueMyanmarNamibiaNepalNetherlandsNew ZealandNicaraguaNigerNigeriaNorth AmericaNorwayOECD membersOmanOther small statesPacific island small statesPakistanPalauPanamaPapua New GuineaParaguayPeruPhilippinesPolandPortugalPost-demographic dividendPre-demographic dividendPuerto RicoQatarRomaniaRussian FederationRwandaSamoaSan MarinoSao Tome and PrincipeSaudi ArabiaSenegalSerbiaSeychellesSierra LeoneSingaporeSlovak RepublicSloveniaSmall statesSolomon IslandsSouth AfricaSouth AsiaSouth Asia (IDA & IBRD)SpainSri LankaSt. Kitts and NevisSt. LuciaSt. Vincent and the GrenadinesSub-Saharan Africa Sub-Saharan Africa (excluding high income)Sub-Saharan Africa (IDA & IBRD countries)SudanSurinameSwazilandSwedenSwitzerlandSyrian Arab RepublicTajikistanTanzaniaThailandTimor-LesteTogoTongaTrinidad and TobagoTunisiaTurkeyTurkmenistanTuvaluUgandaUkraineUnited Arab EmiratesUnited KingdomUnited StatesUpper middle incomeUruguayUzbekistanVanuatuVenezuela, RBVietnamWest Bank and GazaWorldYemen, Rep.ZambiaZimbabwe Timeline:
This timeline shows a graph from 1981 to 2015 of Cabo Verde. No data until 1980. Number of actual observations by date: 35.
Source name:
World Development Indicators
Source organization:
World Bank staff estimates using data from the United Nations Statistics Division's National Accounts Statistics.
Categories, topics:
Economy & Growth, Environment
Last updated:
apr 23, 2017
Indicators value changes by year
Minimum:
14.514
jan 1, 1982
Maximum:
21.864
jan 1, 2015
At the date of observation
Value
Absolute change
Change from previous value
jan 1, 1981
15.768
+15.768
0.0%
jan 1, 1982
14.514
-1.254
-7.95%
jan 1, 1983
15.737
+1.222
8.42%
jan 1, 1984
16.325
+0.588
3.74%
jan 1, 1985
17.267
+0.942
5.77%
jan 1, 1986
17.339
+0.072
0.41%
jan 1, 1987
18.32
+0.981
5.66%
jan 1, 1988
18.678
+0.358
1.95%
jan 1, 1989
18.754
+0.076
0.41%
jan 1, 1990
18.572
-0.181
-0.97%
jan 1, 1991
19.498
+0.925
4.98%
jan 1, 1992
20.325
+0.828
4.25%
jan 1, 1993
20.61
+0.284
1.4%
jan 1, 1994
19.813
-0.797
-3.87%
jan 1, 1995
19.421
-0.392
-1.98%
jan 1, 1996
19.954
+0.533
2.75%
jan 1, 1997
19.48
-0.475
-2.38%
jan 1, 1998
19.389
-0.091
-0.47%
jan 1, 1999
18.706
-0.682
-3.52%
jan 1, 2000
17.051
-1.655
-8.85%
jan 1, 2001
17.409
+0.358
2.1%
jan 1, 2002
16.801
-0.608
-3.49%
jan 1, 2003
16.933
+0.132
0.79%
jan 1, 2004
17.511
+0.577
3.41%
jan 1, 2005
17.361
-0.149
-0.85%
jan 1, 2006
18.099
+0.737
4.25%
jan 1, 2007
17.009
-1.09
-6.02%
jan 1, 2008
15.802
-1.207
-7.1%
jan 1, 2009
16.647
+0.845
5.35%
jan 1, 2010
18.208
+1.562
9.38%
jan 1, 2011
18.629
+0.421
2.31%
jan 1, 2012
19.247
+0.617
3.31%
jan 1, 2013
20.116
+0.869
4.52%
jan 1, 2014
20.746
+0.63
3.13%
jan 1, 2015
21.864
+1.118
5.39%
Ranking of countries by current statistics by years


Comments: