29
/
en
AIzaSyAYiBZKx7MnpbEhh9jyipgxe19OcubqV5w
April 1, 2024
53907
Pacific island small states
PSS
false
2
1
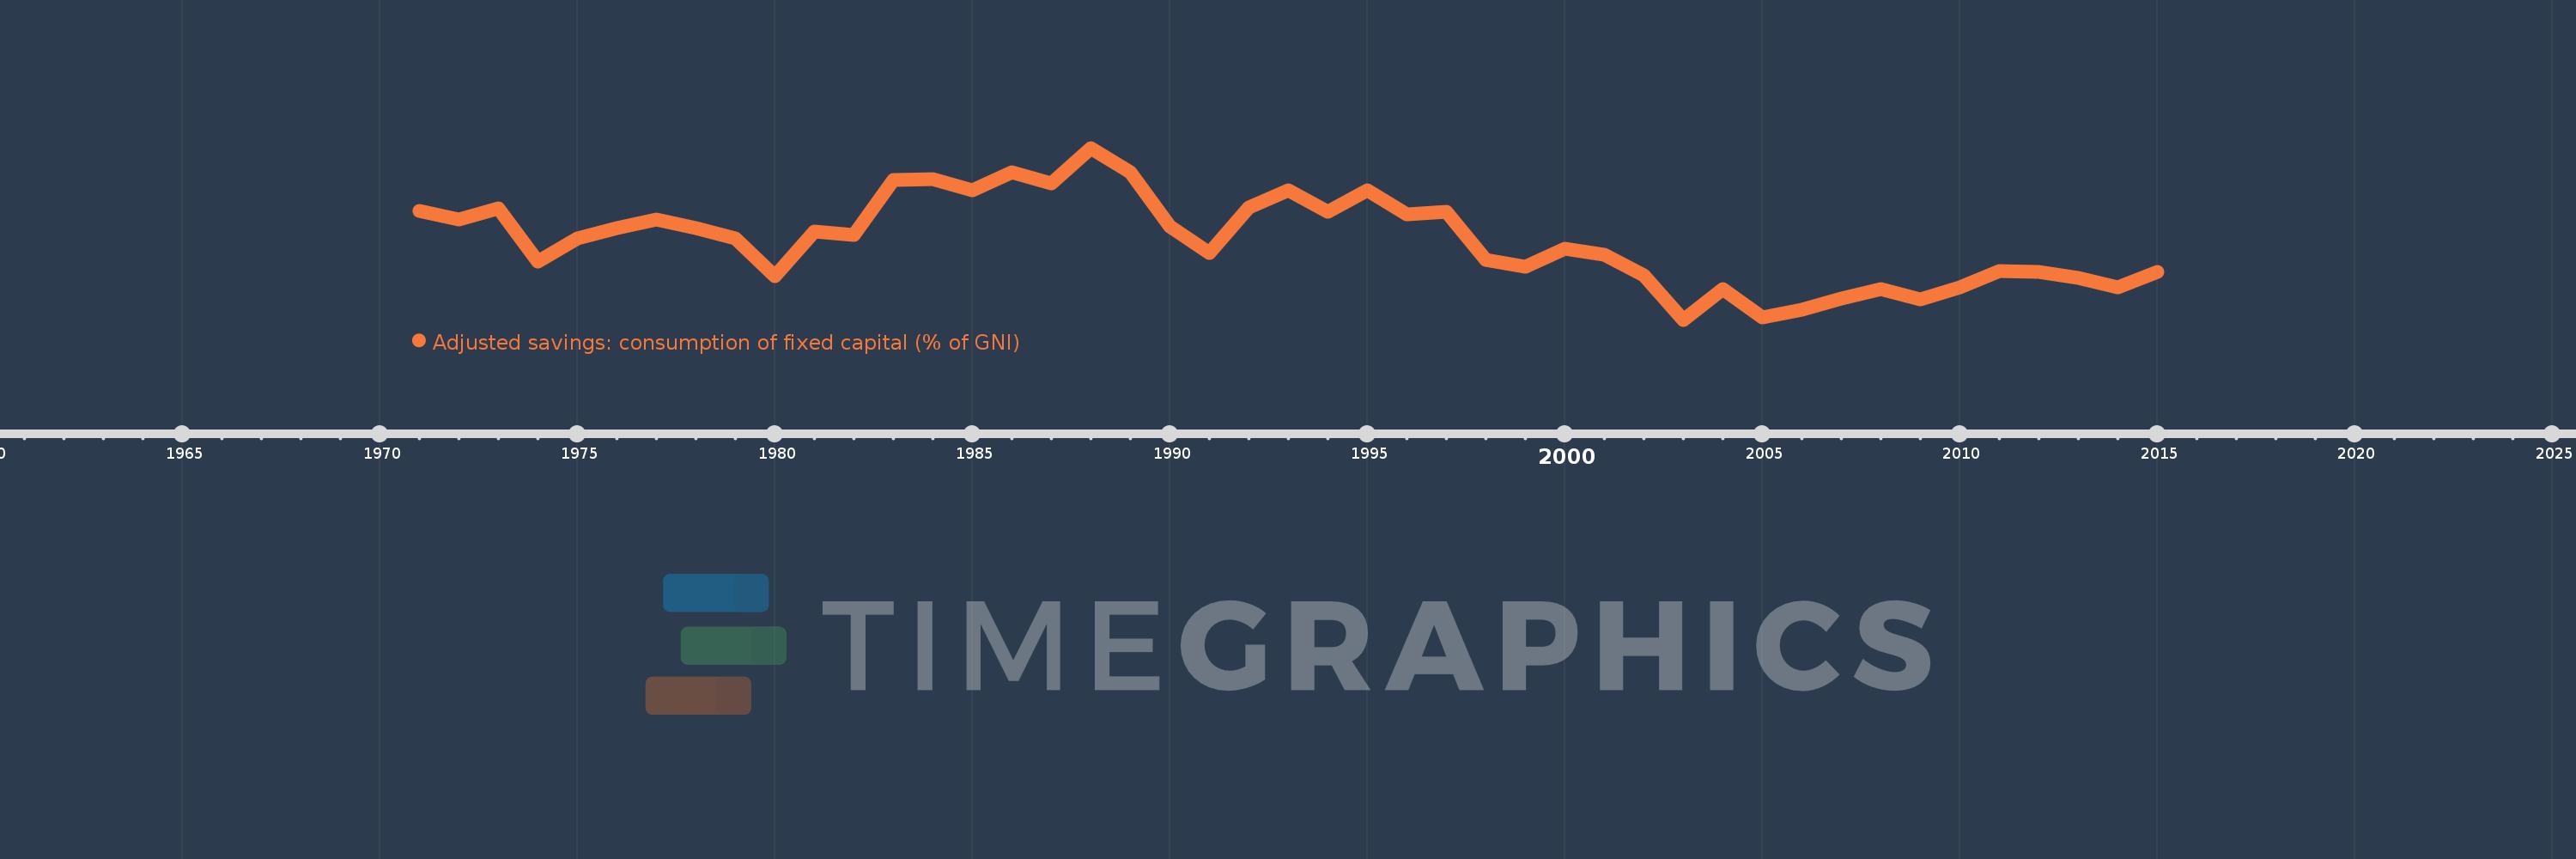
Adjusted savings: consumption of fixed capital (% of GNI)
2015,2014,2013,2012,2011,2010,2009,2008,2007,2006,2005,2004,2003,2002,2001,2000,1999,1998,1997,1996,1995,1994,1993,1992,1991,1990,1989,1988,1987,1986,1985,1984,1983,1982,1981,1980,1979,1978,1977,1976,1975,1974,1973,1972,1971
This statistics in other country:
AfghanistanAlbaniaAlgeriaAndorraAngolaAntigua and BarbudaArab WorldArgentinaArmeniaAustraliaAustriaAzerbaijanBahamas, TheBahrainBangladeshBarbadosBelarusBelgiumBelizeBeninBermudaBhutanBoliviaBosnia and HerzegovinaBotswanaBrazilBrunei DarussalamBulgariaBurkina FasoBurundiCabo VerdeCambodiaCameroonCanadaCaribbean small statesCentral African RepublicCentral Europe and the BalticsChadChileChinaColombiaComorosCongo, Dem. Rep.Congo, Rep.Costa RicaCote d'IvoireCroatiaCubaCyprusCzech RepublicDenmarkDjiboutiDominicaDominican RepublicEarly-demographic dividendEast Asia & PacificEast Asia & Pacific (excluding high income)East Asia & Pacific (IDA & IBRD countries)EcuadorEgypt, Arab Rep.El SalvadorEquatorial GuineaEritreaEstoniaEthiopiaEuro areaEurope & Central AsiaEurope & Central Asia (excluding high income)Europe & Central Asia (IDA & IBRD countries)European UnionFijiFinlandFragile and conflict affected situationsFranceGabonGambia, TheGeorgiaGermanyGhanaGreeceGreenlandGrenadaGuatemalaGuineaGuinea-BissauGuyanaHaitiHeavily indebted poor countries (HIPC)High incomeHondurasHong Kong SAR, ChinaHungaryIBRD onlyIcelandIDA & IBRD totalIDA blendIDA onlyIDA totalIndiaIndonesiaIran, Islamic Rep.IraqIrelandIsraelItalyJamaicaJapanJordanKazakhstanKenyaKiribatiKorea, Rep.KosovoKuwaitKyrgyz RepublicLao PDRLate-demographic dividendLatin America & Caribbean Latin America & Caribbean (excluding high income)Latin America & the Caribbean (IDA & IBRD countries)LatviaLeast developed countries: UN classificationLebanonLesothoLiberiaLibyaLiechtensteinLithuaniaLow & middle incomeLow incomeLower middle incomeLuxembourgMacao SAR, ChinaMacedonia, FYRMadagascarMalawiMalaysiaMaldivesMaliMaltaMarshall IslandsMauritaniaMauritiusMexicoMicronesia, Fed. Sts.Middle East & North AfricaMiddle East & North Africa (excluding high income)Middle East & North Africa (IDA & IBRD countries)Middle incomeMoldovaMonacoMongoliaMontenegroMoroccoMozambiqueMyanmarNamibiaNepalNetherlandsNew ZealandNicaraguaNigerNigeriaNorth AmericaNorwayOECD membersOmanOther small statesPacific island small statesPakistanPalauPanamaPapua New GuineaParaguayPeruPhilippinesPolandPortugalPost-demographic dividendPre-demographic dividendPuerto RicoQatarRomaniaRussian FederationRwandaSamoaSan MarinoSao Tome and PrincipeSaudi ArabiaSenegalSerbiaSeychellesSierra LeoneSingaporeSlovak RepublicSloveniaSmall statesSolomon IslandsSouth AfricaSouth AsiaSouth Asia (IDA & IBRD)SpainSri LankaSt. Kitts and NevisSt. LuciaSt. Vincent and the GrenadinesSub-Saharan Africa Sub-Saharan Africa (excluding high income)Sub-Saharan Africa (IDA & IBRD countries)SudanSurinameSwazilandSwedenSwitzerlandSyrian Arab RepublicTajikistanTanzaniaThailandTimor-LesteTogoTongaTrinidad and TobagoTunisiaTurkeyTurkmenistanTuvaluUgandaUkraineUnited Arab EmiratesUnited KingdomUnited StatesUpper middle incomeUruguayUzbekistanVanuatuVenezuela, RBVietnamWest Bank and GazaWorldYemen, Rep.ZambiaZimbabwe Timeline:
This timeline shows a graph from 1971 to 2015 of Pacific island small states. No data until 1970. Number of actual observations by date: 45.
Source name:
World Development Indicators
Source organization:
World Bank staff estimates using data from the United Nations Statistics Division's National Accounts Statistics.
Categories, topics:
Economy & Growth, Environment
Last updated:
apr 23, 2017
Indicators value changes by year
Maximum:
12.235
jan 1, 1988
At the date of observation
Value
Absolute change
Change from previous value
jan 1, 1971
10.919
+10.919
0.0%
jan 1, 1972
10.749
-0.17
-1.56%
jan 1, 1973
10.984
+0.236
2.19%
jan 1, 1974
9.867
-1.117
-10.17%
jan 1, 1975
10.354
+0.487
4.93%
jan 1, 1976
10.567
+0.213
2.06%
jan 1, 1977
10.744
+0.176
1.67%
jan 1, 1978
10.562
-0.182
-1.69%
jan 1, 1979
10.345
-0.216
-2.05%
jan 1, 1980
9.568
-0.778
-7.52%
jan 1, 1981
10.503
+0.935
9.78%
jan 1, 1982
10.417
-0.087
-0.82%
jan 1, 1983
11.574
+1.157
11.11%
jan 1, 1984
11.578
+0.004
0.03%
jan 1, 1985
11.348
-0.23
-1.99%
jan 1, 1986
11.725
+0.377
3.32%
jan 1, 1987
11.503
-0.222
-1.89%
jan 1, 1988
12.235
+0.732
6.36%
jan 1, 1989
11.732
-0.502
-4.11%
jan 1, 1990
10.6
-1.133
-9.65%
jan 1, 1991
10.04
-0.56
-5.28%
jan 1, 1992
10.99
+0.95
9.46%
jan 1, 1993
11.352
+0.362
3.3%
jan 1, 1994
10.914
-0.438
-3.86%
jan 1, 1995
11.359
+0.446
4.09%
jan 1, 1996
10.854
-0.506
-4.45%
jan 1, 1997
10.897
+0.043
0.4%
jan 1, 1998
9.898
-0.999
-9.17%
jan 1, 1999
9.766
-0.132
-1.34%
jan 1, 2000
10.139
+0.373
3.82%
jan 1, 2001
10.016
-0.123
-1.21%
jan 1, 2002
9.586
-0.43
-4.29%
jan 1, 2003
8.657
-0.929
-9.69%
jan 1, 2004
9.293
+0.636
7.35%
jan 1, 2005
8.702
-0.591
-6.36%
jan 1, 2006
8.859
+0.156
1.8%
jan 1, 2007
9.095
+0.237
2.67%
jan 1, 2008
9.299
+0.203
2.24%
jan 1, 2009
9.085
-0.214
-2.31%
jan 1, 2010
9.323
+0.238
2.62%
jan 1, 2011
9.666
+0.343
3.68%
jan 1, 2012
9.651
-0.015
-0.15%
jan 1, 2013
9.531
-0.12
-1.25%
jan 1, 2014
9.338
-0.193
-2.02%
jan 1, 2015
9.662
+0.324
3.47%
Ranking of countries by current statistics by years


Comments: