29
/
en
AIzaSyAYiBZKx7MnpbEhh9jyipgxe19OcubqV5w
April 1, 2024
41192
Latin America & Caribbean
LCN
false
2
1
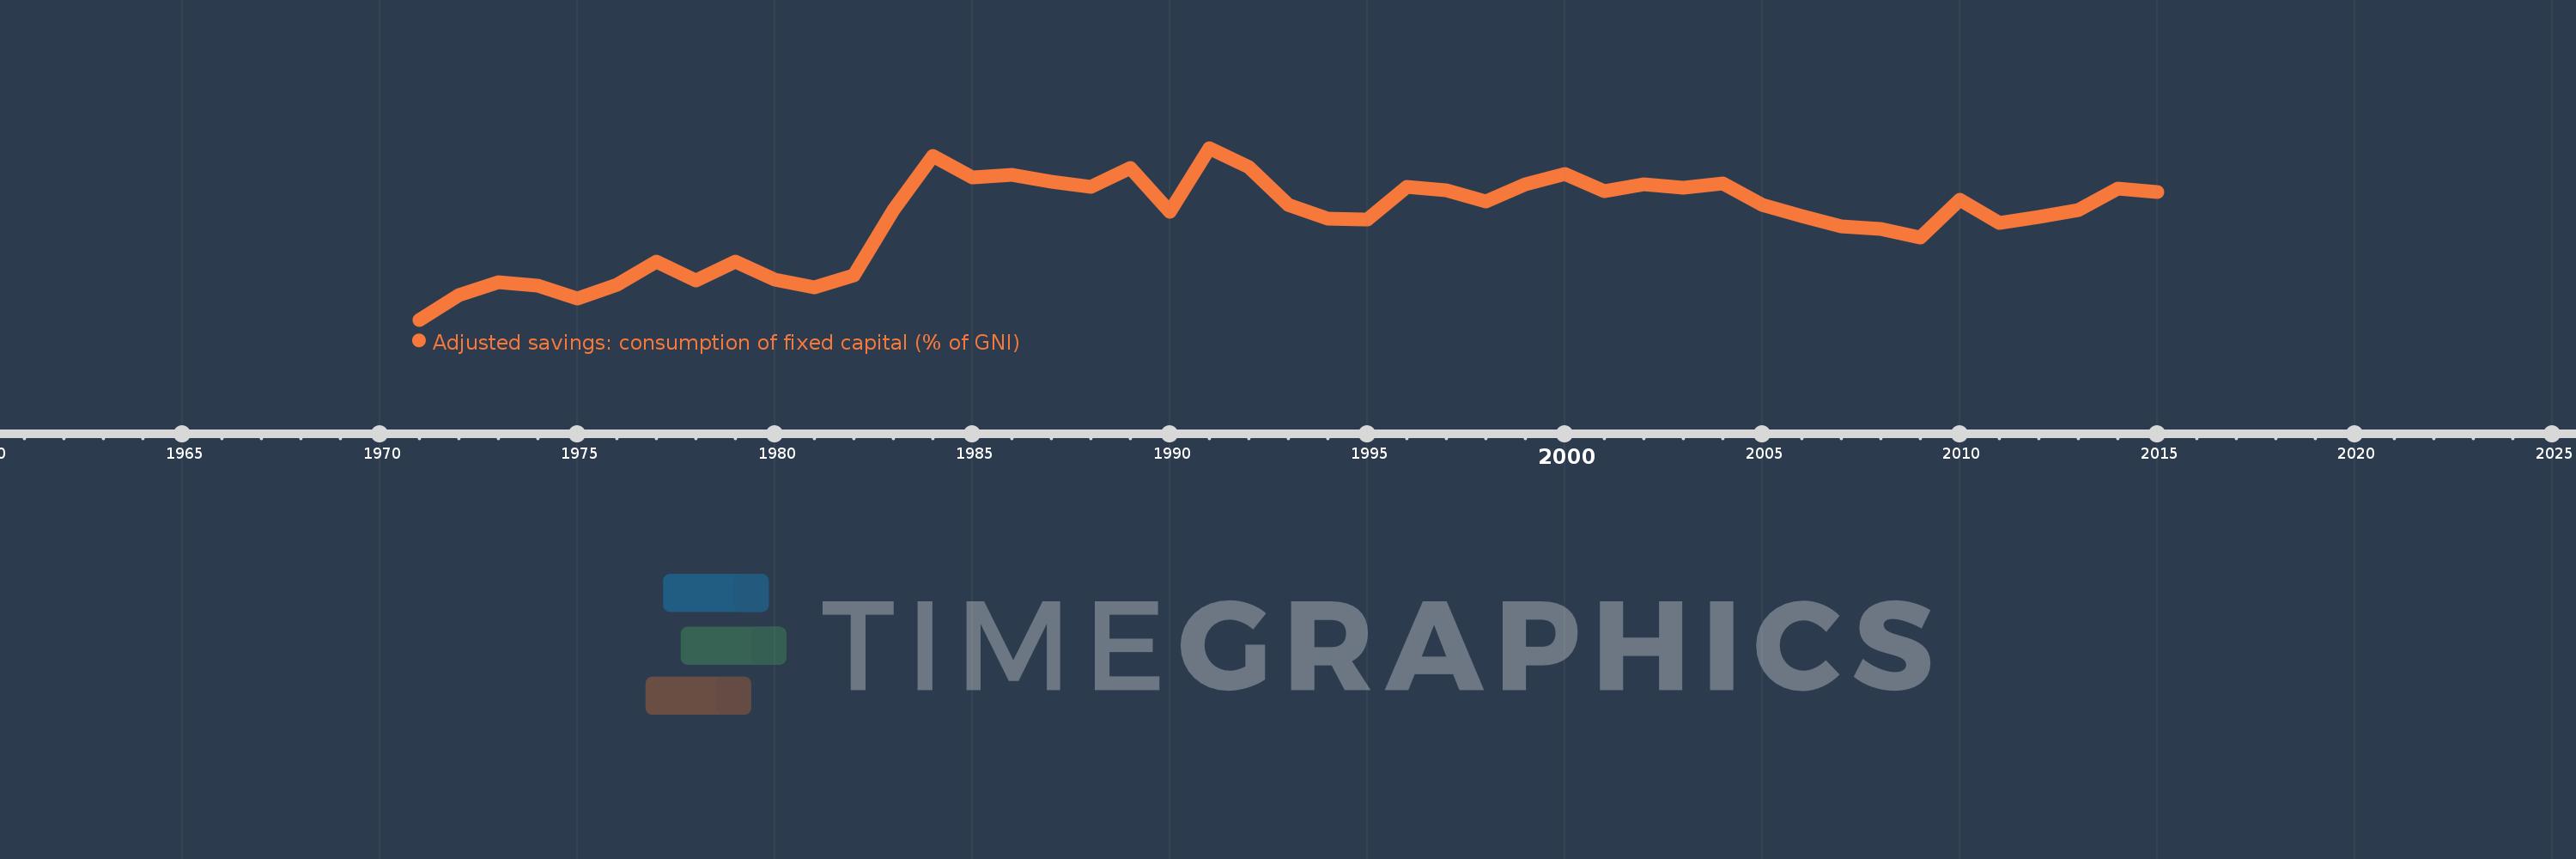
Adjusted savings: consumption of fixed capital (% of GNI)
2015,2014,2013,2012,2011,2010,2009,2008,2007,2006,2005,2004,2003,2002,2001,2000,1999,1998,1997,1996,1995,1994,1993,1992,1991,1990,1989,1988,1987,1986,1985,1984,1983,1982,1981,1980,1979,1978,1977,1976,1975,1974,1973,1972,1971
This statistics in other country:
AfghanistanAlbaniaAlgeriaAndorraAngolaAntigua and BarbudaArab WorldArgentinaArmeniaAustraliaAustriaAzerbaijanBahamas, TheBahrainBangladeshBarbadosBelarusBelgiumBelizeBeninBermudaBhutanBoliviaBosnia and HerzegovinaBotswanaBrazilBrunei DarussalamBulgariaBurkina FasoBurundiCabo VerdeCambodiaCameroonCanadaCaribbean small statesCentral African RepublicCentral Europe and the BalticsChadChileChinaColombiaComorosCongo, Dem. Rep.Congo, Rep.Costa RicaCote d'IvoireCroatiaCubaCyprusCzech RepublicDenmarkDjiboutiDominicaDominican RepublicEarly-demographic dividendEast Asia & PacificEast Asia & Pacific (excluding high income)East Asia & Pacific (IDA & IBRD countries)EcuadorEgypt, Arab Rep.El SalvadorEquatorial GuineaEritreaEstoniaEthiopiaEuro areaEurope & Central AsiaEurope & Central Asia (excluding high income)Europe & Central Asia (IDA & IBRD countries)European UnionFijiFinlandFragile and conflict affected situationsFranceGabonGambia, TheGeorgiaGermanyGhanaGreeceGreenlandGrenadaGuatemalaGuineaGuinea-BissauGuyanaHaitiHeavily indebted poor countries (HIPC)High incomeHondurasHong Kong SAR, ChinaHungaryIBRD onlyIcelandIDA & IBRD totalIDA blendIDA onlyIDA totalIndiaIndonesiaIran, Islamic Rep.IraqIrelandIsraelItalyJamaicaJapanJordanKazakhstanKenyaKiribatiKorea, Rep.KosovoKuwaitKyrgyz RepublicLao PDRLate-demographic dividendLatin America & Caribbean Latin America & Caribbean (excluding high income)Latin America & the Caribbean (IDA & IBRD countries)LatviaLeast developed countries: UN classificationLebanonLesothoLiberiaLibyaLiechtensteinLithuaniaLow & middle incomeLow incomeLower middle incomeLuxembourgMacao SAR, ChinaMacedonia, FYRMadagascarMalawiMalaysiaMaldivesMaliMaltaMarshall IslandsMauritaniaMauritiusMexicoMicronesia, Fed. Sts.Middle East & North AfricaMiddle East & North Africa (excluding high income)Middle East & North Africa (IDA & IBRD countries)Middle incomeMoldovaMonacoMongoliaMontenegroMoroccoMozambiqueMyanmarNamibiaNepalNetherlandsNew ZealandNicaraguaNigerNigeriaNorth AmericaNorwayOECD membersOmanOther small statesPacific island small statesPakistanPalauPanamaPapua New GuineaParaguayPeruPhilippinesPolandPortugalPost-demographic dividendPre-demographic dividendPuerto RicoQatarRomaniaRussian FederationRwandaSamoaSan MarinoSao Tome and PrincipeSaudi ArabiaSenegalSerbiaSeychellesSierra LeoneSingaporeSlovak RepublicSloveniaSmall statesSolomon IslandsSouth AfricaSouth AsiaSouth Asia (IDA & IBRD)SpainSri LankaSt. Kitts and NevisSt. LuciaSt. Vincent and the GrenadinesSub-Saharan Africa Sub-Saharan Africa (excluding high income)Sub-Saharan Africa (IDA & IBRD countries)SudanSurinameSwazilandSwedenSwitzerlandSyrian Arab RepublicTajikistanTanzaniaThailandTimor-LesteTogoTongaTrinidad and TobagoTunisiaTurkeyTurkmenistanTuvaluUgandaUkraineUnited Arab EmiratesUnited KingdomUnited StatesUpper middle incomeUruguayUzbekistanVanuatuVenezuela, RBVietnamWest Bank and GazaWorldYemen, Rep.ZambiaZimbabwe Timeline:
This timeline shows a graph from 1971 to 2015 of Latin America & Caribbean . No data until 1970. Number of actual observations by date: 45.
Source name:
World Development Indicators
Source organization:
World Bank staff estimates using data from the United Nations Statistics Division's National Accounts Statistics.
Categories, topics:
Economy & Growth, Environment
Last updated:
apr 23, 2017
Indicators value changes by year
Maximum:
12.103
jan 1, 1991
At the date of observation
Value
Absolute change
Change from previous value
jan 1, 1971
8.354
+8.354
0.0%
jan 1, 1972
8.885
+0.531
6.35%
jan 1, 1973
9.173
+0.289
3.25%
jan 1, 1974
9.1
-0.073
-0.8%
jan 1, 1975
8.816
-0.284
-3.13%
jan 1, 1976
9.12
+0.304
3.45%
jan 1, 1977
9.624
+0.504
5.52%
jan 1, 1978
9.213
-0.411
-4.27%
jan 1, 1979
9.617
+0.404
4.39%
jan 1, 1980
9.234
-0.384
-3.99%
jan 1, 1981
9.053
-0.181
-1.96%
jan 1, 1982
9.332
+0.279
3.08%
jan 1, 1983
10.751
+1.419
15.21%
jan 1, 1984
11.937
+1.186
11.03%
jan 1, 1985
11.454
-0.483
-4.05%
jan 1, 1986
11.52
+0.066
0.58%
jan 1, 1987
11.369
-0.151
-1.31%
jan 1, 1988
11.245
-0.123
-1.09%
jan 1, 1989
11.67
+0.425
3.78%
jan 1, 1990
10.709
-0.961
-8.24%
jan 1, 1991
12.103
+1.395
13.02%
jan 1, 1992
11.683
-0.421
-3.47%
jan 1, 1993
10.858
-0.825
-7.06%
jan 1, 1994
10.565
-0.293
-2.7%
jan 1, 1995
10.538
-0.026
-0.25%
jan 1, 1996
11.254
+0.715
6.79%
jan 1, 1997
11.178
-0.076
-0.67%
jan 1, 1998
10.93
-0.248
-2.22%
jan 1, 1999
11.307
+0.376
3.44%
jan 1, 2000
11.535
+0.228
2.02%
jan 1, 2001
11.164
-0.37
-3.21%
jan 1, 2002
11.306
+0.141
1.26%
jan 1, 2003
11.231
-0.075
-0.66%
jan 1, 2004
11.331
+0.1
0.89%
jan 1, 2005
10.866
-0.465
-4.1%
jan 1, 2006
10.615
-0.251
-2.31%
jan 1, 2007
10.383
-0.232
-2.18%
jan 1, 2008
10.332
-0.051
-0.49%
jan 1, 2009
10.155
-0.177
-1.71%
jan 1, 2010
10.969
+0.814
8.02%
jan 1, 2011
10.473
-0.496
-4.52%
jan 1, 2012
10.596
+0.123
1.17%
jan 1, 2013
10.743
+0.147
1.39%
jan 1, 2014
11.222
+0.479
4.46%
jan 1, 2015
11.133
-0.089
-0.8%
Ranking of countries by current statistics by years


Comments: