29
/
en
AIzaSyAYiBZKx7MnpbEhh9jyipgxe19OcubqV5w
April 1, 2024
49768
Middle East & North Africa (IDA & IBRD countries)
TMN
false
2
1
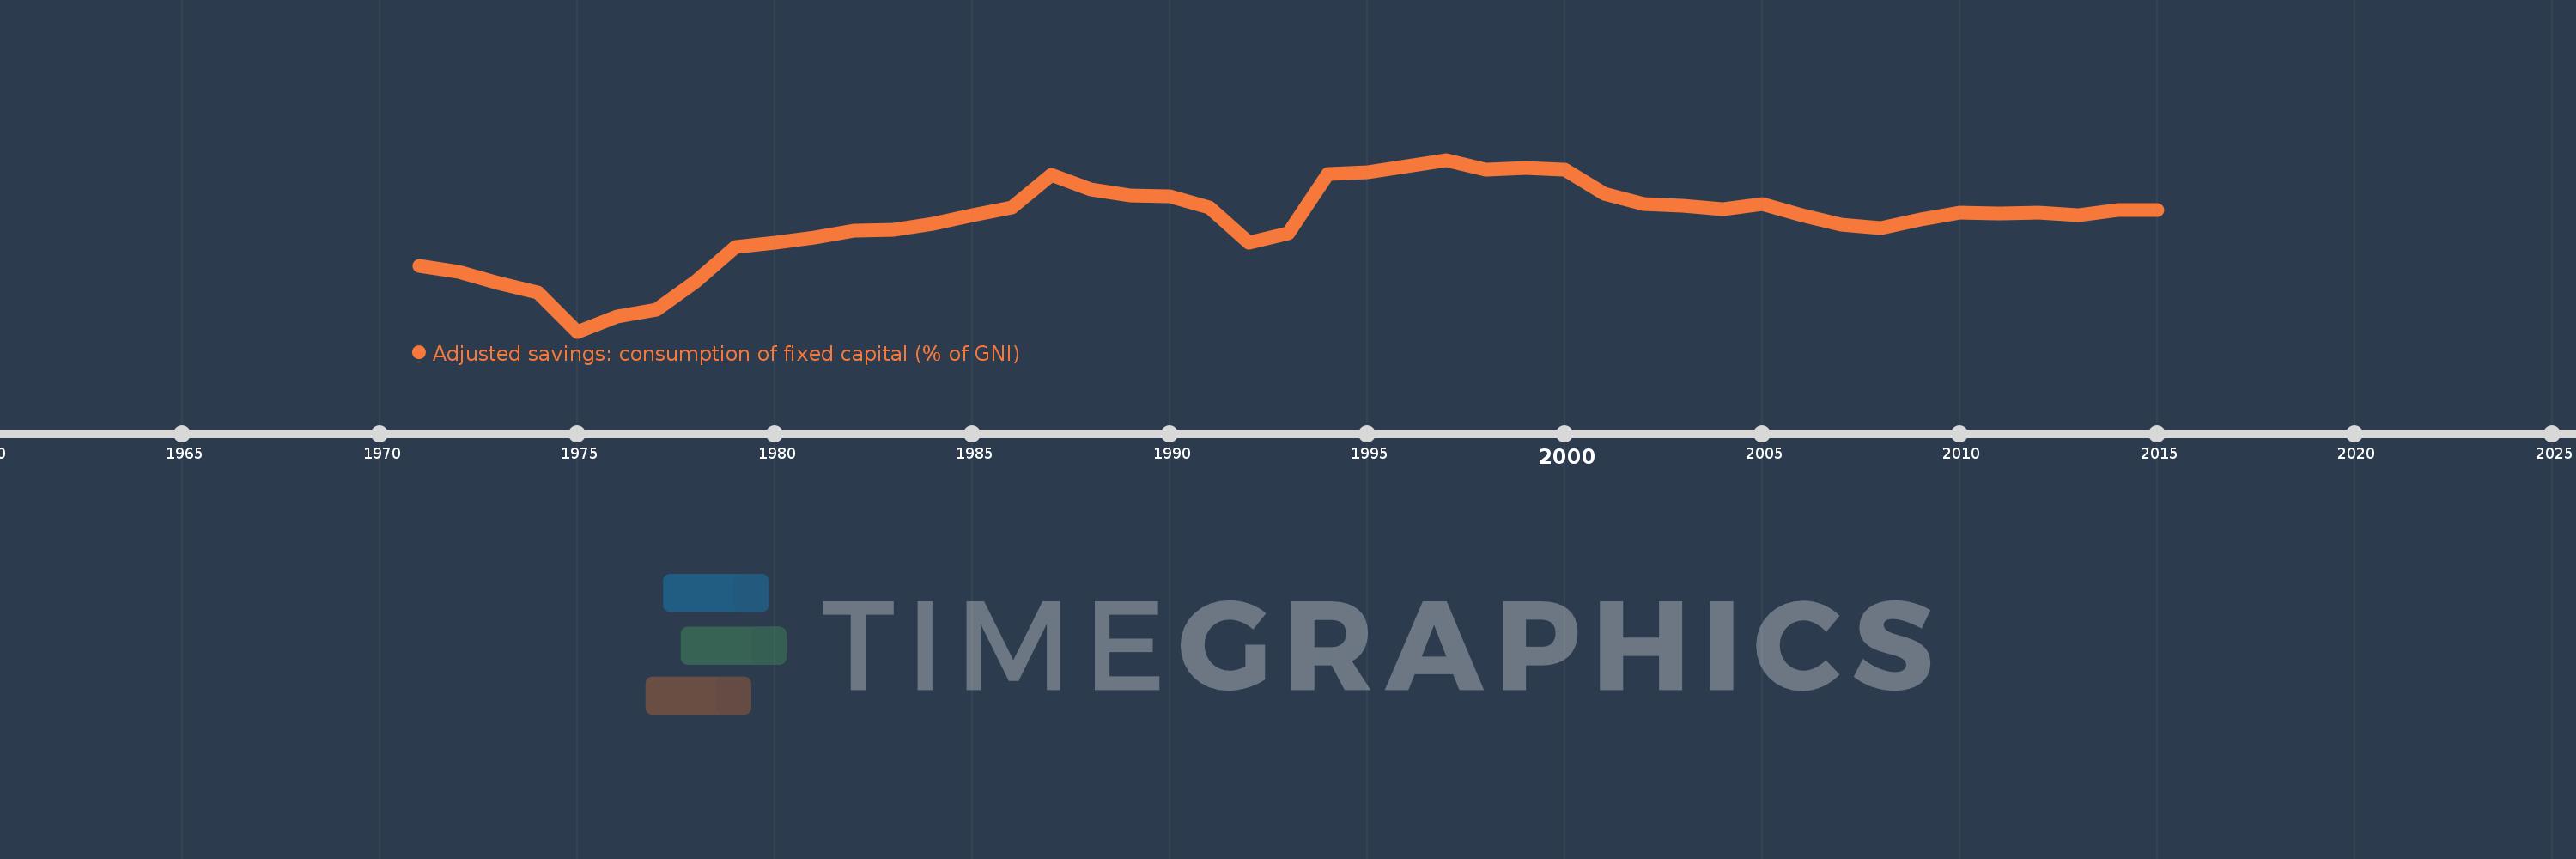
Adjusted savings: consumption of fixed capital (% of GNI)
2015,2014,2013,2012,2011,2010,2009,2008,2007,2006,2005,2004,2003,2002,2001,2000,1999,1998,1997,1996,1995,1994,1993,1992,1991,1990,1989,1988,1987,1986,1985,1984,1983,1982,1981,1980,1979,1978,1977,1976,1975,1974,1973,1972,1971
This statistics in other country:
AfghanistanAlbaniaAlgeriaAndorraAngolaAntigua and BarbudaArab WorldArgentinaArmeniaAustraliaAustriaAzerbaijanBahamas, TheBahrainBangladeshBarbadosBelarusBelgiumBelizeBeninBermudaBhutanBoliviaBosnia and HerzegovinaBotswanaBrazilBrunei DarussalamBulgariaBurkina FasoBurundiCabo VerdeCambodiaCameroonCanadaCaribbean small statesCentral African RepublicCentral Europe and the BalticsChadChileChinaColombiaComorosCongo, Dem. Rep.Congo, Rep.Costa RicaCote d'IvoireCroatiaCubaCyprusCzech RepublicDenmarkDjiboutiDominicaDominican RepublicEarly-demographic dividendEast Asia & PacificEast Asia & Pacific (excluding high income)East Asia & Pacific (IDA & IBRD countries)EcuadorEgypt, Arab Rep.El SalvadorEquatorial GuineaEritreaEstoniaEthiopiaEuro areaEurope & Central AsiaEurope & Central Asia (excluding high income)Europe & Central Asia (IDA & IBRD countries)European UnionFijiFinlandFragile and conflict affected situationsFranceGabonGambia, TheGeorgiaGermanyGhanaGreeceGreenlandGrenadaGuatemalaGuineaGuinea-BissauGuyanaHaitiHeavily indebted poor countries (HIPC)High incomeHondurasHong Kong SAR, ChinaHungaryIBRD onlyIcelandIDA & IBRD totalIDA blendIDA onlyIDA totalIndiaIndonesiaIran, Islamic Rep.IraqIrelandIsraelItalyJamaicaJapanJordanKazakhstanKenyaKiribatiKorea, Rep.KosovoKuwaitKyrgyz RepublicLao PDRLate-demographic dividendLatin America & Caribbean Latin America & Caribbean (excluding high income)Latin America & the Caribbean (IDA & IBRD countries)LatviaLeast developed countries: UN classificationLebanonLesothoLiberiaLibyaLiechtensteinLithuaniaLow & middle incomeLow incomeLower middle incomeLuxembourgMacao SAR, ChinaMacedonia, FYRMadagascarMalawiMalaysiaMaldivesMaliMaltaMarshall IslandsMauritaniaMauritiusMexicoMicronesia, Fed. Sts.Middle East & North AfricaMiddle East & North Africa (excluding high income)Middle East & North Africa (IDA & IBRD countries)Middle incomeMoldovaMonacoMongoliaMontenegroMoroccoMozambiqueMyanmarNamibiaNepalNetherlandsNew ZealandNicaraguaNigerNigeriaNorth AmericaNorwayOECD membersOmanOther small statesPacific island small statesPakistanPalauPanamaPapua New GuineaParaguayPeruPhilippinesPolandPortugalPost-demographic dividendPre-demographic dividendPuerto RicoQatarRomaniaRussian FederationRwandaSamoaSan MarinoSao Tome and PrincipeSaudi ArabiaSenegalSerbiaSeychellesSierra LeoneSingaporeSlovak RepublicSloveniaSmall statesSolomon IslandsSouth AfricaSouth AsiaSouth Asia (IDA & IBRD)SpainSri LankaSt. Kitts and NevisSt. LuciaSt. Vincent and the GrenadinesSub-Saharan Africa Sub-Saharan Africa (excluding high income)Sub-Saharan Africa (IDA & IBRD countries)SudanSurinameSwazilandSwedenSwitzerlandSyrian Arab RepublicTajikistanTanzaniaThailandTimor-LesteTogoTongaTrinidad and TobagoTunisiaTurkeyTurkmenistanTuvaluUgandaUkraineUnited Arab EmiratesUnited KingdomUnited StatesUpper middle incomeUruguayUzbekistanVanuatuVenezuela, RBVietnamWest Bank and GazaWorldYemen, Rep.ZambiaZimbabwe Timeline:
This timeline shows a graph from 1971 to 2015 of Middle East & North Africa (IDA & IBRD countries). No data until 1970. Number of actual observations by date: 45.
Source name:
World Development Indicators
Source organization:
World Bank staff estimates using data from the United Nations Statistics Division's National Accounts Statistics.
Categories, topics:
Economy & Growth, Environment
Last updated:
apr 23, 2017
Indicators value changes by year
Maximum:
11.712
jan 1, 1997
At the date of observation
Value
Absolute change
Change from previous value
jan 1, 1971
7.135
+7.135
0.0%
jan 1, 1972
6.876
-0.259
-3.64%
jan 1, 1973
6.381
-0.495
-7.2%
jan 1, 1974
5.977
-0.403
-6.32%
jan 1, 1975
4.299
-1.678
-28.07%
jan 1, 1976
4.944
+0.645
15.0%
jan 1, 1977
5.253
+0.309
6.24%
jan 1, 1978
6.464
+1.211
23.05%
jan 1, 1979
7.941
+1.477
22.85%
jan 1, 1980
8.144
+0.203
2.56%
jan 1, 1981
8.35
+0.206
2.53%
jan 1, 1982
8.66
+0.31
3.71%
jan 1, 1983
8.709
+0.05
0.57%
jan 1, 1984
8.939
+0.23
2.64%
jan 1, 1985
9.331
+0.393
4.39%
jan 1, 1986
9.672
+0.341
3.65%
jan 1, 1987
11.048
+1.375
14.22%
jan 1, 1988
10.439
-0.609
-5.51%
jan 1, 1989
10.165
-0.273
-2.62%
jan 1, 1990
10.123
-0.042
-0.42%
jan 1, 1991
9.65
-0.473
-4.67%
jan 1, 1992
8.133
-1.517
-15.72%
jan 1, 1993
8.536
+0.403
4.95%
jan 1, 1994
11.115
+2.579
30.22%
jan 1, 1995
11.169
+0.053
0.48%
jan 1, 1996
11.416
+0.247
2.21%
jan 1, 1997
11.712
+0.296
2.59%
jan 1, 1998
11.299
-0.413
-3.53%
jan 1, 1999
11.347
+0.048
0.42%
jan 1, 2000
11.29
-0.057
-0.5%
jan 1, 2001
10.265
-1.025
-9.08%
jan 1, 2002
9.82
-0.444
-4.33%
jan 1, 2003
9.733
-0.088
-0.89%
jan 1, 2004
9.586
-0.146
-1.5%
jan 1, 2005
9.81
+0.224
2.34%
jan 1, 2006
9.313
-0.497
-5.07%
jan 1, 2007
8.909
-0.404
-4.34%
jan 1, 2008
8.768
-0.141
-1.58%
jan 1, 2009
9.148
+0.38
4.34%
jan 1, 2010
9.427
+0.279
3.04%
jan 1, 2011
9.392
-0.035
-0.37%
jan 1, 2012
9.418
+0.026
0.28%
jan 1, 2013
9.317
-0.101
-1.07%
jan 1, 2014
9.539
+0.222
2.38%
jan 1, 2015
9.527
-0.013
-0.13%
Ranking of countries by current statistics by years


Comments: