29
/
en
AIzaSyAYiBZKx7MnpbEhh9jyipgxe19OcubqV5w
April 1, 2024
193844
Mauritius
MUS
true
2
1
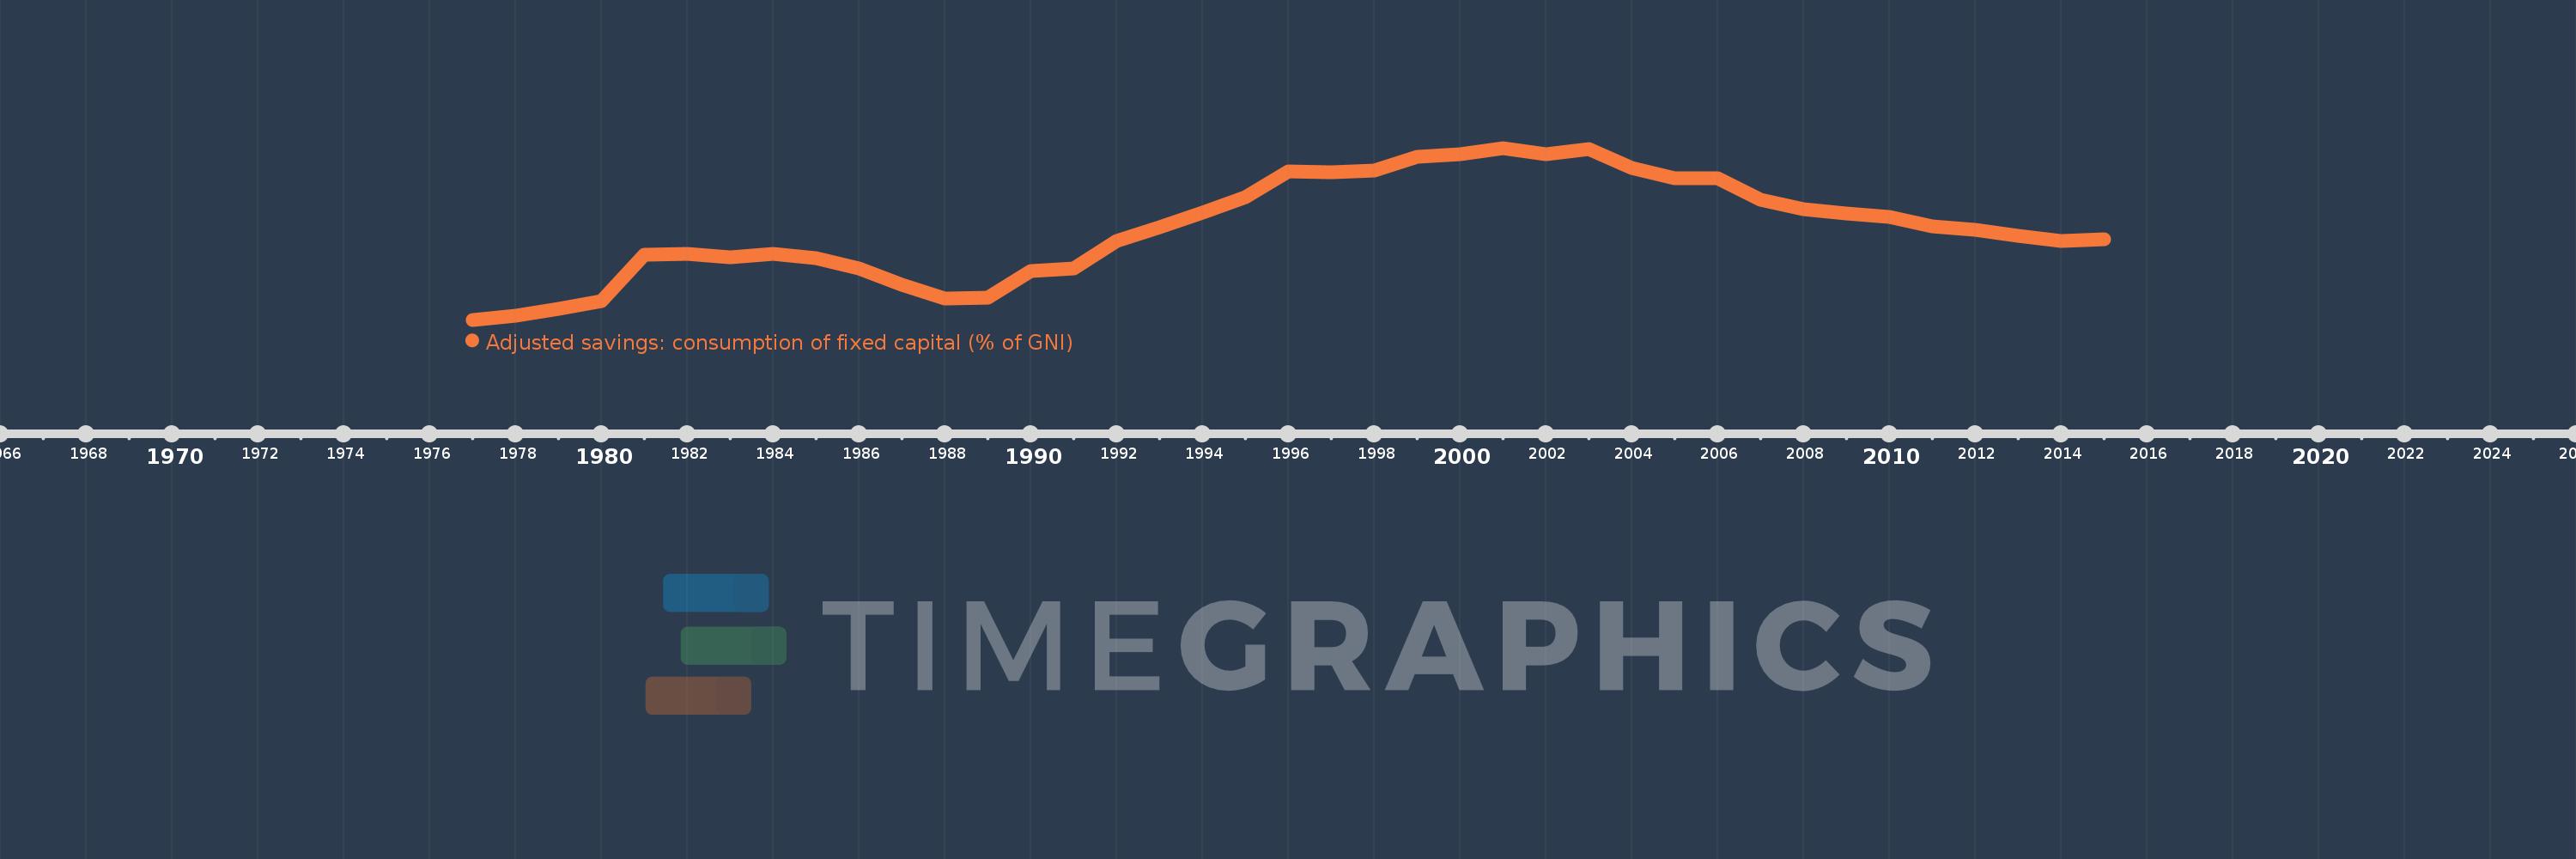
Adjusted savings: consumption of fixed capital (% of GNI)
2015,2014,2013,2012,2011,2010,2009,2008,2007,2006,2005,2004,2003,2002,2001,2000,1999,1998,1997,1996,1995,1994,1993,1992,1991,1990,1989,1988,1987,1986,1985,1984,1983,1982,1981,1980,1979,1978,1977
This statistics in other country:
AfghanistanAlbaniaAlgeriaAndorraAngolaAntigua and BarbudaArab WorldArgentinaArmeniaAustraliaAustriaAzerbaijanBahamas, TheBahrainBangladeshBarbadosBelarusBelgiumBelizeBeninBermudaBhutanBoliviaBosnia and HerzegovinaBotswanaBrazilBrunei DarussalamBulgariaBurkina FasoBurundiCabo VerdeCambodiaCameroonCanadaCaribbean small statesCentral African RepublicCentral Europe and the BalticsChadChileChinaColombiaComorosCongo, Dem. Rep.Congo, Rep.Costa RicaCote d'IvoireCroatiaCubaCyprusCzech RepublicDenmarkDjiboutiDominicaDominican RepublicEarly-demographic dividendEast Asia & PacificEast Asia & Pacific (excluding high income)East Asia & Pacific (IDA & IBRD countries)EcuadorEgypt, Arab Rep.El SalvadorEquatorial GuineaEritreaEstoniaEthiopiaEuro areaEurope & Central AsiaEurope & Central Asia (excluding high income)Europe & Central Asia (IDA & IBRD countries)European UnionFijiFinlandFragile and conflict affected situationsFranceGabonGambia, TheGeorgiaGermanyGhanaGreeceGreenlandGrenadaGuatemalaGuineaGuinea-BissauGuyanaHaitiHeavily indebted poor countries (HIPC)High incomeHondurasHong Kong SAR, ChinaHungaryIBRD onlyIcelandIDA & IBRD totalIDA blendIDA onlyIDA totalIndiaIndonesiaIran, Islamic Rep.IraqIrelandIsraelItalyJamaicaJapanJordanKazakhstanKenyaKiribatiKorea, Rep.KosovoKuwaitKyrgyz RepublicLao PDRLate-demographic dividendLatin America & Caribbean Latin America & Caribbean (excluding high income)Latin America & the Caribbean (IDA & IBRD countries)LatviaLeast developed countries: UN classificationLebanonLesothoLiberiaLibyaLiechtensteinLithuaniaLow & middle incomeLow incomeLower middle incomeLuxembourgMacao SAR, ChinaMacedonia, FYRMadagascarMalawiMalaysiaMaldivesMaliMaltaMarshall IslandsMauritaniaMauritiusMexicoMicronesia, Fed. Sts.Middle East & North AfricaMiddle East & North Africa (excluding high income)Middle East & North Africa (IDA & IBRD countries)Middle incomeMoldovaMonacoMongoliaMontenegroMoroccoMozambiqueMyanmarNamibiaNepalNetherlandsNew ZealandNicaraguaNigerNigeriaNorth AmericaNorwayOECD membersOmanOther small statesPacific island small statesPakistanPalauPanamaPapua New GuineaParaguayPeruPhilippinesPolandPortugalPost-demographic dividendPre-demographic dividendPuerto RicoQatarRomaniaRussian FederationRwandaSamoaSan MarinoSao Tome and PrincipeSaudi ArabiaSenegalSerbiaSeychellesSierra LeoneSingaporeSlovak RepublicSloveniaSmall statesSolomon IslandsSouth AfricaSouth AsiaSouth Asia (IDA & IBRD)SpainSri LankaSt. Kitts and NevisSt. LuciaSt. Vincent and the GrenadinesSub-Saharan Africa Sub-Saharan Africa (excluding high income)Sub-Saharan Africa (IDA & IBRD countries)SudanSurinameSwazilandSwedenSwitzerlandSyrian Arab RepublicTajikistanTanzaniaThailandTimor-LesteTogoTongaTrinidad and TobagoTunisiaTurkeyTurkmenistanTuvaluUgandaUkraineUnited Arab EmiratesUnited KingdomUnited StatesUpper middle incomeUruguayUzbekistanVanuatuVenezuela, RBVietnamWest Bank and GazaWorldYemen, Rep.ZambiaZimbabwe Timeline:
This timeline shows a graph from 1977 to 2015 of Mauritius. No data until 1976. Number of actual observations by date: 39.
Source name:
World Development Indicators
Source organization:
World Bank staff estimates using data from the United Nations Statistics Division's National Accounts Statistics.
Categories, topics:
Economy & Growth, Environment
Last updated:
apr 23, 2017
Indicators value changes by year
Maximum:
12.106
jan 1, 2001
At the date of observation
Value
Absolute change
Change from previous value
jan 1, 1977
6.871
+6.871
0.0%
jan 1, 1978
6.988
+0.116
1.69%
jan 1, 1979
7.214
+0.226
3.23%
jan 1, 1980
7.445
+0.231
3.21%
jan 1, 1981
8.859
+1.414
18.99%
jan 1, 1982
8.872
+0.013
0.15%
jan 1, 1983
8.766
-0.106
-1.19%
jan 1, 1984
8.88
+0.113
1.29%
jan 1, 1985
8.743
-0.137
-1.54%
jan 1, 1986
8.442
-0.301
-3.44%
jan 1, 1987
7.931
-0.512
-6.06%
jan 1, 1988
7.51
-0.42
-5.3%
jan 1, 1989
7.552
+0.042
0.56%
jan 1, 1990
8.347
+0.794
10.52%
jan 1, 1991
8.423
+0.077
0.92%
jan 1, 1992
9.283
+0.86
10.21%
jan 1, 1993
9.679
+0.396
4.26%
jan 1, 1994
10.137
+0.458
4.74%
jan 1, 1995
10.604
+0.466
4.6%
jan 1, 1996
11.4
+0.796
7.51%
jan 1, 1997
11.36
-0.041
-0.36%
jan 1, 1998
11.425
+0.066
0.58%
jan 1, 1999
11.841
+0.416
3.64%
jan 1, 2000
11.918
+0.077
0.65%
jan 1, 2001
12.106
+0.188
1.58%
jan 1, 2002
11.925
-0.181
-1.5%
jan 1, 2003
12.072
+0.147
1.23%
jan 1, 2004
11.502
-0.57
-4.72%
jan 1, 2005
11.171
-0.331
-2.88%
jan 1, 2006
11.17
-0.001
-0.01%
jan 1, 2007
10.529
-0.641
-5.74%
jan 1, 2008
10.238
-0.291
-2.76%
jan 1, 2009
10.121
-0.117
-1.14%
jan 1, 2010
9.993
-0.128
-1.27%
jan 1, 2011
9.714
-0.279
-2.79%
jan 1, 2012
9.622
-0.092
-0.95%
jan 1, 2013
9.433
-0.189
-1.97%
jan 1, 2014
9.263
-0.169
-1.8%
jan 1, 2015
9.315
+0.052
0.56%
Ranking of countries by current statistics by years


Comments: