29
/
en
AIzaSyAYiBZKx7MnpbEhh9jyipgxe19OcubqV5w
April 1, 2024
187411
Malaysia
MYS
true
2
1
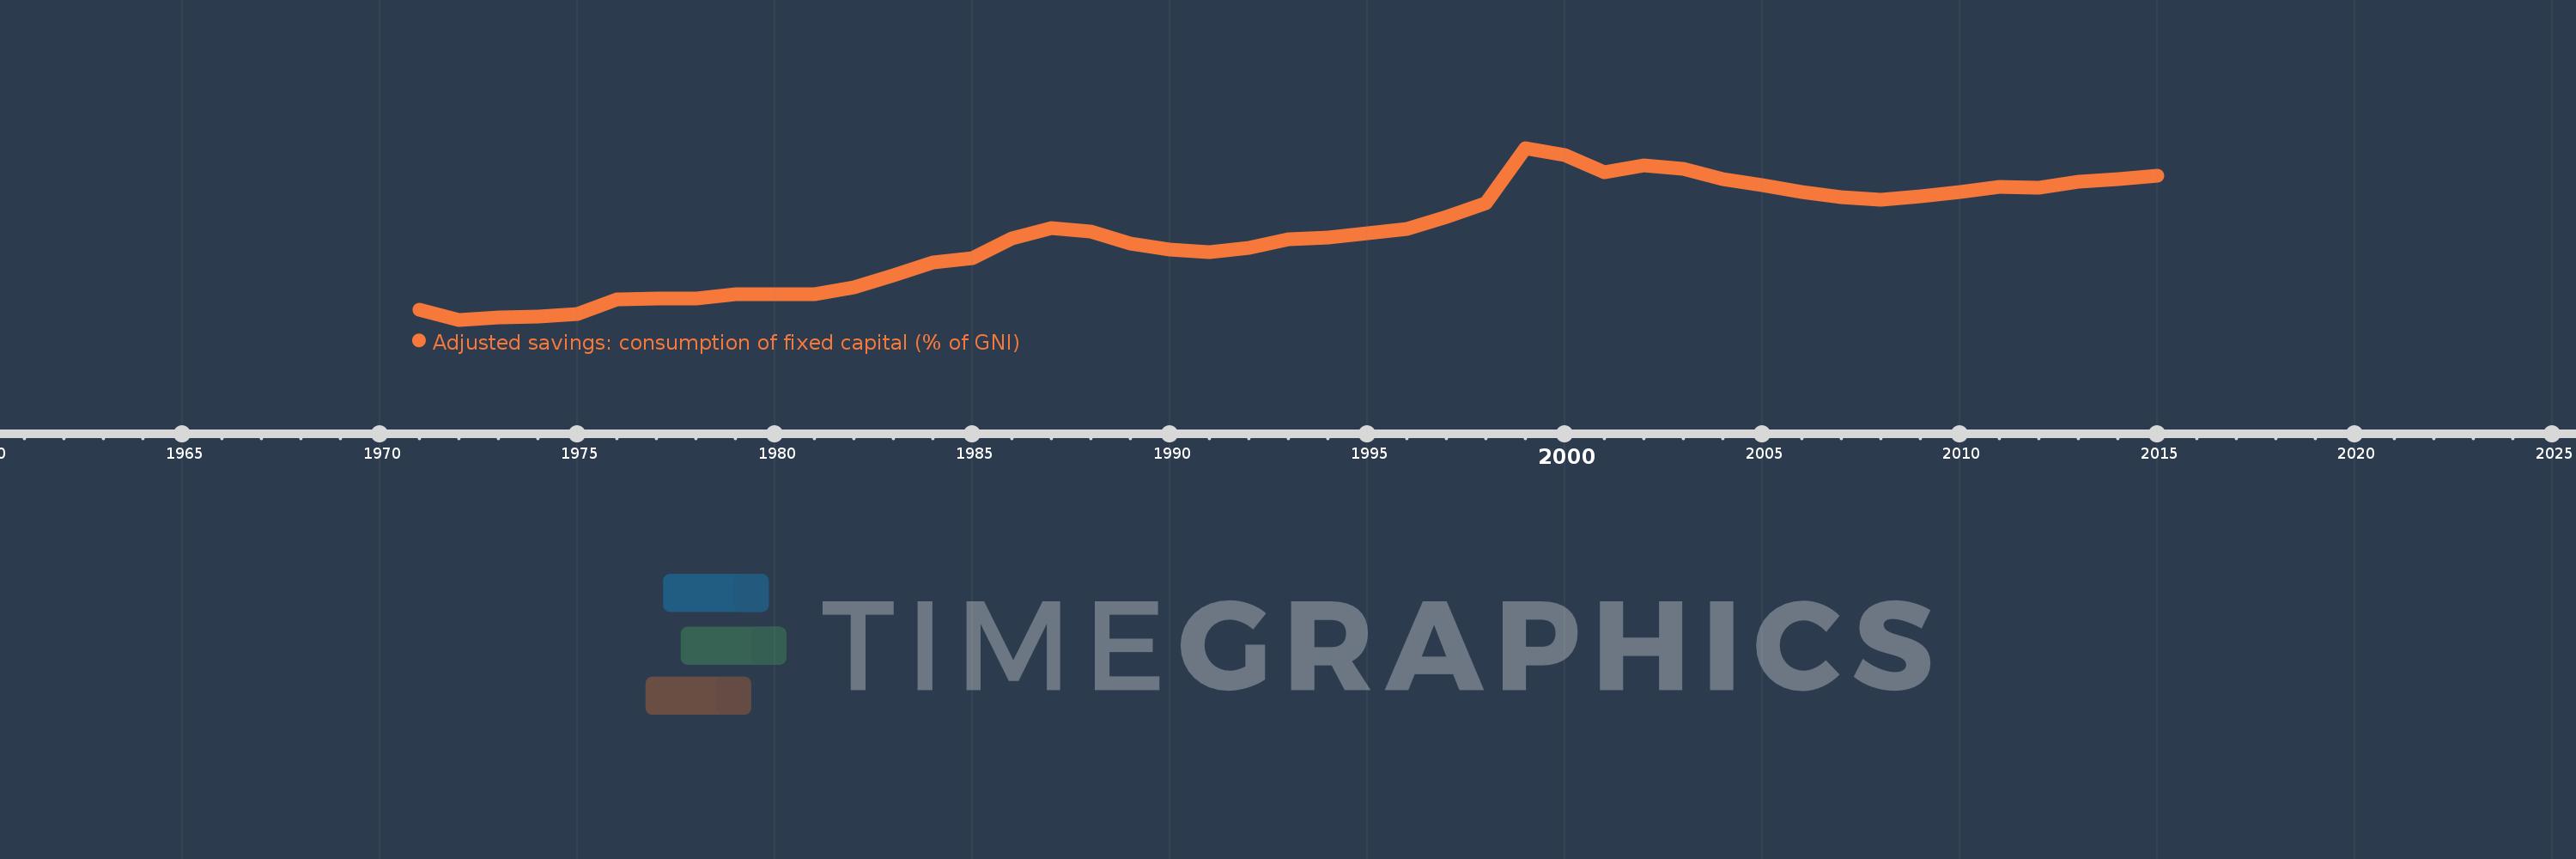
Adjusted savings: consumption of fixed capital (% of GNI)
2015,2014,2013,2012,2011,2010,2009,2008,2007,2006,2005,2004,2003,2002,2001,2000,1999,1998,1997,1996,1995,1994,1993,1992,1991,1990,1989,1988,1987,1986,1985,1984,1983,1982,1981,1980,1979,1978,1977,1976,1975,1974,1973,1972,1971
This statistics in other country:
AfghanistanAlbaniaAlgeriaAndorraAngolaAntigua and BarbudaArab WorldArgentinaArmeniaAustraliaAustriaAzerbaijanBahamas, TheBahrainBangladeshBarbadosBelarusBelgiumBelizeBeninBermudaBhutanBoliviaBosnia and HerzegovinaBotswanaBrazilBrunei DarussalamBulgariaBurkina FasoBurundiCabo VerdeCambodiaCameroonCanadaCaribbean small statesCentral African RepublicCentral Europe and the BalticsChadChileChinaColombiaComorosCongo, Dem. Rep.Congo, Rep.Costa RicaCote d'IvoireCroatiaCubaCyprusCzech RepublicDenmarkDjiboutiDominicaDominican RepublicEarly-demographic dividendEast Asia & PacificEast Asia & Pacific (excluding high income)East Asia & Pacific (IDA & IBRD countries)EcuadorEgypt, Arab Rep.El SalvadorEquatorial GuineaEritreaEstoniaEthiopiaEuro areaEurope & Central AsiaEurope & Central Asia (excluding high income)Europe & Central Asia (IDA & IBRD countries)European UnionFijiFinlandFragile and conflict affected situationsFranceGabonGambia, TheGeorgiaGermanyGhanaGreeceGreenlandGrenadaGuatemalaGuineaGuinea-BissauGuyanaHaitiHeavily indebted poor countries (HIPC)High incomeHondurasHong Kong SAR, ChinaHungaryIBRD onlyIcelandIDA & IBRD totalIDA blendIDA onlyIDA totalIndiaIndonesiaIran, Islamic Rep.IraqIrelandIsraelItalyJamaicaJapanJordanKazakhstanKenyaKiribatiKorea, Rep.KosovoKuwaitKyrgyz RepublicLao PDRLate-demographic dividendLatin America & Caribbean Latin America & Caribbean (excluding high income)Latin America & the Caribbean (IDA & IBRD countries)LatviaLeast developed countries: UN classificationLebanonLesothoLiberiaLibyaLiechtensteinLithuaniaLow & middle incomeLow incomeLower middle incomeLuxembourgMacao SAR, ChinaMacedonia, FYRMadagascarMalawiMalaysiaMaldivesMaliMaltaMarshall IslandsMauritaniaMauritiusMexicoMicronesia, Fed. Sts.Middle East & North AfricaMiddle East & North Africa (excluding high income)Middle East & North Africa (IDA & IBRD countries)Middle incomeMoldovaMonacoMongoliaMontenegroMoroccoMozambiqueMyanmarNamibiaNepalNetherlandsNew ZealandNicaraguaNigerNigeriaNorth AmericaNorwayOECD membersOmanOther small statesPacific island small statesPakistanPalauPanamaPapua New GuineaParaguayPeruPhilippinesPolandPortugalPost-demographic dividendPre-demographic dividendPuerto RicoQatarRomaniaRussian FederationRwandaSamoaSan MarinoSao Tome and PrincipeSaudi ArabiaSenegalSerbiaSeychellesSierra LeoneSingaporeSlovak RepublicSloveniaSmall statesSolomon IslandsSouth AfricaSouth AsiaSouth Asia (IDA & IBRD)SpainSri LankaSt. Kitts and NevisSt. LuciaSt. Vincent and the GrenadinesSub-Saharan Africa Sub-Saharan Africa (excluding high income)Sub-Saharan Africa (IDA & IBRD countries)SudanSurinameSwazilandSwedenSwitzerlandSyrian Arab RepublicTajikistanTanzaniaThailandTimor-LesteTogoTongaTrinidad and TobagoTunisiaTurkeyTurkmenistanTuvaluUgandaUkraineUnited Arab EmiratesUnited KingdomUnited StatesUpper middle incomeUruguayUzbekistanVanuatuVenezuela, RBVietnamWest Bank and GazaWorldYemen, Rep.ZambiaZimbabwe Timeline:
This timeline shows a graph from 1971 to 2015 of Malaysia. No data until 1970. Number of actual observations by date: 45.
Source name:
World Development Indicators
Source organization:
World Bank staff estimates using data from the United Nations Statistics Division's National Accounts Statistics.
Categories, topics:
Economy & Growth, Environment
Last updated:
apr 23, 2017
Indicators value changes by year
Maximum:
20.198
jan 1, 1999
At the date of observation
Value
Absolute change
Change from previous value
jan 1, 1971
6.186
+6.186
0.0%
jan 1, 1972
5.341
-0.846
-13.67%
jan 1, 1973
5.531
+0.19
3.56%
jan 1, 1974
5.6
+0.069
1.26%
jan 1, 1975
5.871
+0.27
4.83%
jan 1, 1976
7.087
+1.216
20.72%
jan 1, 1977
7.18
+0.093
1.32%
jan 1, 1978
7.207
+0.027
0.38%
jan 1, 1979
7.539
+0.332
4.6%
jan 1, 1980
7.53
-0.009
-0.13%
jan 1, 1981
7.576
+0.046
0.61%
jan 1, 1982
8.158
+0.582
7.69%
jan 1, 1983
9.168
+1.01
12.38%
jan 1, 1984
10.272
+1.104
12.04%
jan 1, 1985
10.692
+0.42
4.09%
jan 1, 1986
12.383
+1.69
15.81%
jan 1, 1987
13.276
+0.893
7.21%
jan 1, 1988
12.936
-0.339
-2.56%
jan 1, 1989
11.898
-1.038
-8.02%
jan 1, 1990
11.414
-0.485
-4.07%
jan 1, 1991
11.178
-0.236
-2.07%
jan 1, 1992
11.558
+0.38
3.4%
jan 1, 1993
12.323
+0.765
6.62%
jan 1, 1994
12.464
+0.141
1.14%
jan 1, 1995
12.835
+0.372
2.98%
jan 1, 1996
13.2
+0.364
2.84%
jan 1, 1997
14.23
+1.03
7.8%
jan 1, 1998
15.397
+1.167
8.2%
jan 1, 1999
20.198
+4.802
31.19%
jan 1, 2000
19.578
-0.62
-3.07%
jan 1, 2001
18.11
-1.468
-7.5%
jan 1, 2002
18.718
+0.608
3.36%
jan 1, 2003
18.37
-0.348
-1.86%
jan 1, 2004
17.522
-0.848
-4.62%
jan 1, 2005
16.981
-0.541
-3.09%
jan 1, 2006
16.369
-0.612
-3.6%
jan 1, 2007
15.925
-0.444
-2.71%
jan 1, 2008
15.727
-0.199
-1.25%
jan 1, 2009
16.043
+0.316
2.01%
jan 1, 2010
16.409
+0.366
2.28%
jan 1, 2011
16.803
+0.394
2.4%
jan 1, 2012
16.783
-0.02
-0.12%
jan 1, 2013
17.298
+0.515
3.07%
jan 1, 2014
17.518
+0.22
1.27%
jan 1, 2015
17.809
+0.291
1.66%
Ranking of countries by current statistics by years


Comments: