29
/
en
AIzaSyAYiBZKx7MnpbEhh9jyipgxe19OcubqV5w
April 1, 2024
202499
Mozambique
MOZ
true
2
1
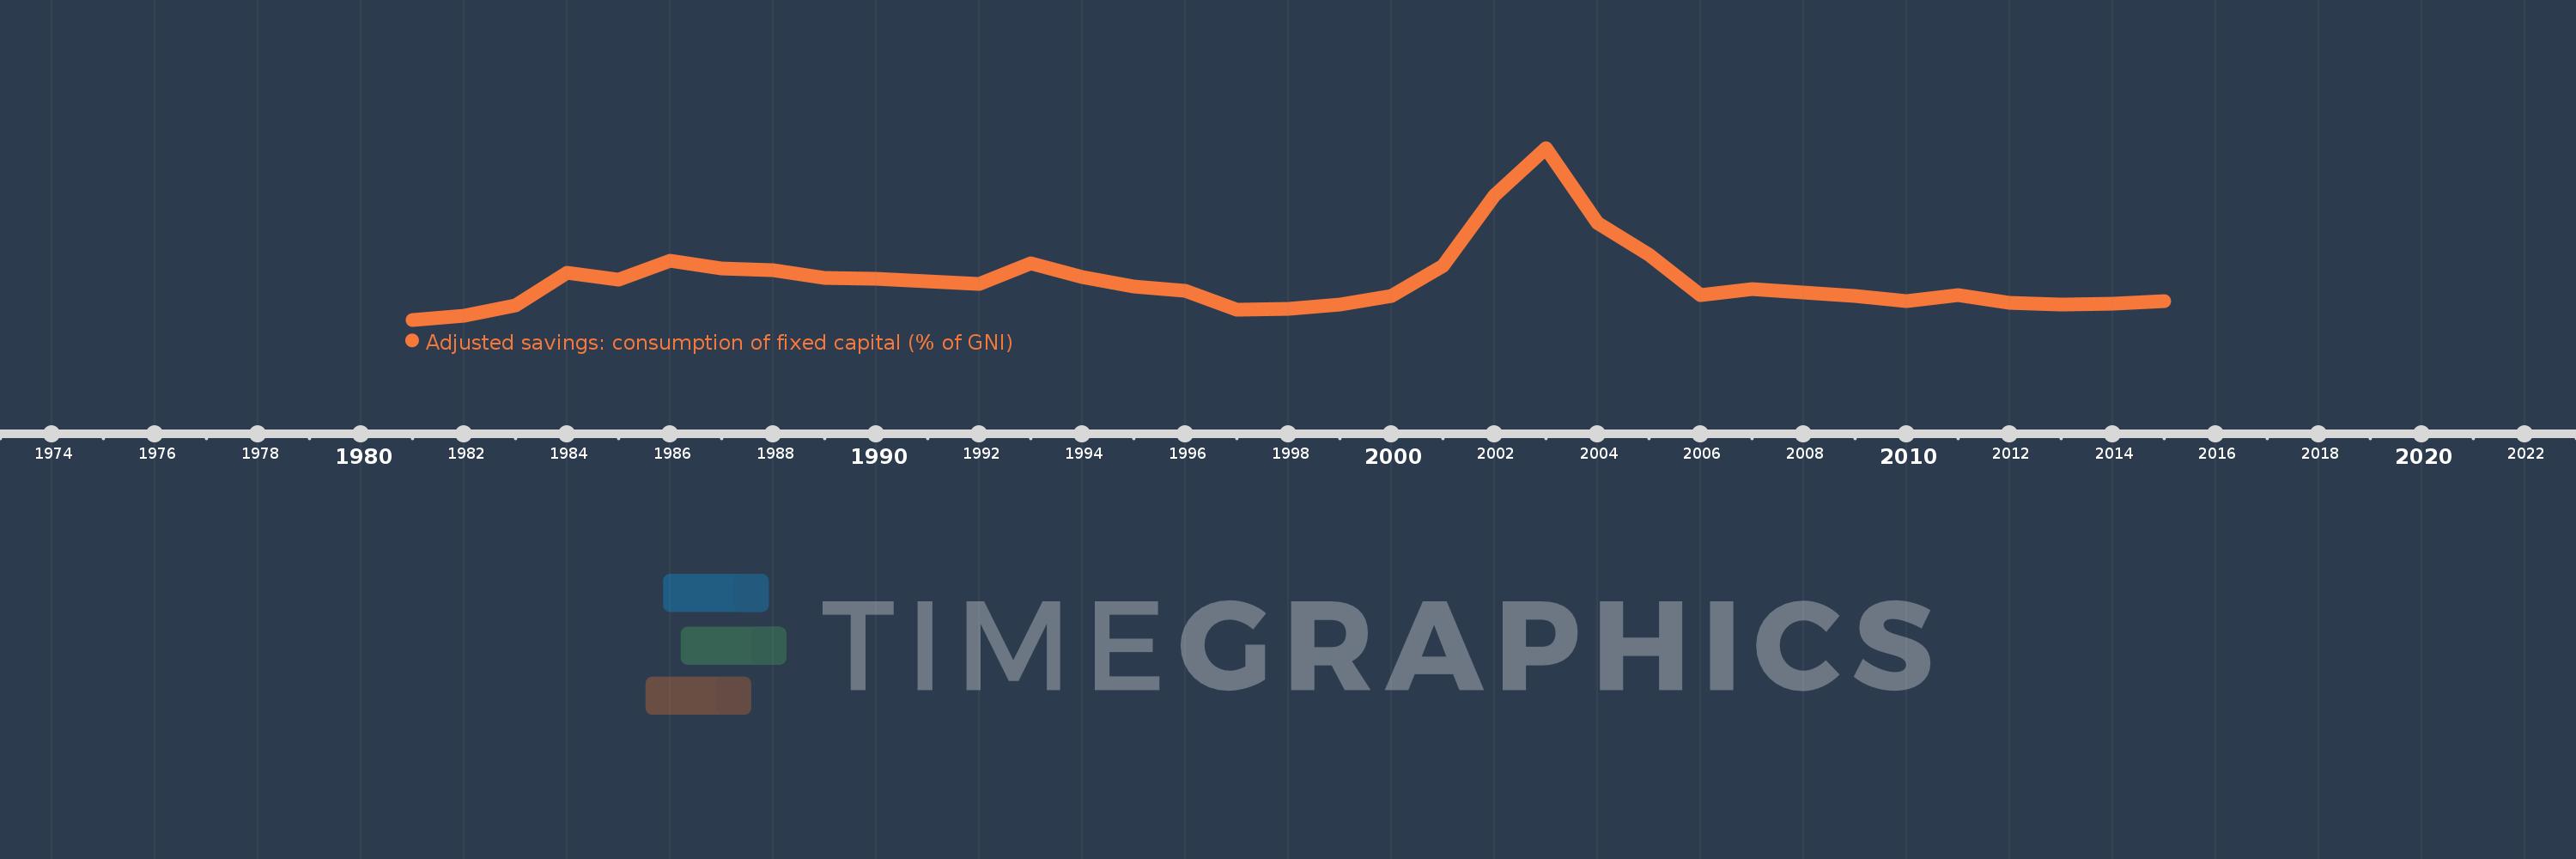
Adjusted savings: consumption of fixed capital (% of GNI)
2015,2014,2013,2012,2011,2010,2009,2008,2007,2006,2005,2004,2003,2002,2001,2000,1999,1998,1997,1996,1995,1994,1993,1992,1991,1990,1989,1988,1987,1986,1985,1984,1983,1982,1981
This statistics in other country:
AfghanistanAlbaniaAlgeriaAndorraAngolaAntigua and BarbudaArab WorldArgentinaArmeniaAustraliaAustriaAzerbaijanBahamas, TheBahrainBangladeshBarbadosBelarusBelgiumBelizeBeninBermudaBhutanBoliviaBosnia and HerzegovinaBotswanaBrazilBrunei DarussalamBulgariaBurkina FasoBurundiCabo VerdeCambodiaCameroonCanadaCaribbean small statesCentral African RepublicCentral Europe and the BalticsChadChileChinaColombiaComorosCongo, Dem. Rep.Congo, Rep.Costa RicaCote d'IvoireCroatiaCubaCyprusCzech RepublicDenmarkDjiboutiDominicaDominican RepublicEarly-demographic dividendEast Asia & PacificEast Asia & Pacific (excluding high income)East Asia & Pacific (IDA & IBRD countries)EcuadorEgypt, Arab Rep.El SalvadorEquatorial GuineaEritreaEstoniaEthiopiaEuro areaEurope & Central AsiaEurope & Central Asia (excluding high income)Europe & Central Asia (IDA & IBRD countries)European UnionFijiFinlandFragile and conflict affected situationsFranceGabonGambia, TheGeorgiaGermanyGhanaGreeceGreenlandGrenadaGuatemalaGuineaGuinea-BissauGuyanaHaitiHeavily indebted poor countries (HIPC)High incomeHondurasHong Kong SAR, ChinaHungaryIBRD onlyIcelandIDA & IBRD totalIDA blendIDA onlyIDA totalIndiaIndonesiaIran, Islamic Rep.IraqIrelandIsraelItalyJamaicaJapanJordanKazakhstanKenyaKiribatiKorea, Rep.KosovoKuwaitKyrgyz RepublicLao PDRLate-demographic dividendLatin America & Caribbean Latin America & Caribbean (excluding high income)Latin America & the Caribbean (IDA & IBRD countries)LatviaLeast developed countries: UN classificationLebanonLesothoLiberiaLibyaLiechtensteinLithuaniaLow & middle incomeLow incomeLower middle incomeLuxembourgMacao SAR, ChinaMacedonia, FYRMadagascarMalawiMalaysiaMaldivesMaliMaltaMarshall IslandsMauritaniaMauritiusMexicoMicronesia, Fed. Sts.Middle East & North AfricaMiddle East & North Africa (excluding high income)Middle East & North Africa (IDA & IBRD countries)Middle incomeMoldovaMonacoMongoliaMontenegroMoroccoMozambiqueMyanmarNamibiaNepalNetherlandsNew ZealandNicaraguaNigerNigeriaNorth AmericaNorwayOECD membersOmanOther small statesPacific island small statesPakistanPalauPanamaPapua New GuineaParaguayPeruPhilippinesPolandPortugalPost-demographic dividendPre-demographic dividendPuerto RicoQatarRomaniaRussian FederationRwandaSamoaSan MarinoSao Tome and PrincipeSaudi ArabiaSenegalSerbiaSeychellesSierra LeoneSingaporeSlovak RepublicSloveniaSmall statesSolomon IslandsSouth AfricaSouth AsiaSouth Asia (IDA & IBRD)SpainSri LankaSt. Kitts and NevisSt. LuciaSt. Vincent and the GrenadinesSub-Saharan Africa Sub-Saharan Africa (excluding high income)Sub-Saharan Africa (IDA & IBRD countries)SudanSurinameSwazilandSwedenSwitzerlandSyrian Arab RepublicTajikistanTanzaniaThailandTimor-LesteTogoTongaTrinidad and TobagoTunisiaTurkeyTurkmenistanTuvaluUgandaUkraineUnited Arab EmiratesUnited KingdomUnited StatesUpper middle incomeUruguayUzbekistanVanuatuVenezuela, RBVietnamWest Bank and GazaWorldYemen, Rep.ZambiaZimbabwe Timeline:
This timeline shows a graph from 1981 to 2015 of Mozambique. No data until 1980. Number of actual observations by date: 35.
Source name:
World Development Indicators
Source organization:
World Bank staff estimates using data from the United Nations Statistics Division's National Accounts Statistics.
Categories, topics:
Economy & Growth, Environment
Last updated:
apr 23, 2017
Indicators value changes by year
Maximum:
16.261
jan 1, 2003
At the date of observation
Value
Absolute change
Change from previous value
jan 1, 1981
9.059
+9.059
0.0%
jan 1, 1982
9.223
+0.164
1.81%
jan 1, 1983
9.664
+0.441
4.78%
jan 1, 1984
11.015
+1.351
13.98%
jan 1, 1985
10.748
-0.267
-2.42%
jan 1, 1986
11.534
+0.786
7.31%
jan 1, 1987
11.195
-0.339
-2.94%
jan 1, 1988
11.13
-0.065
-0.58%
jan 1, 1989
10.801
-0.329
-2.96%
jan 1, 1990
10.76
-0.041
-0.38%
jan 1, 1991
10.671
-0.089
-0.83%
jan 1, 1992
10.549
-0.123
-1.15%
jan 1, 1993
11.43
+0.881
8.35%
jan 1, 1994
10.851
-0.578
-5.06%
jan 1, 1995
10.461
-0.39
-3.59%
jan 1, 1996
10.28
-0.181
-1.73%
jan 1, 1997
9.484
-0.797
-7.75%
jan 1, 1998
9.534
+0.05
0.53%
jan 1, 1999
9.681
+0.147
1.54%
jan 1, 2000
10.051
+0.37
3.83%
jan 1, 2001
11.3
+1.249
12.42%
jan 1, 2002
14.264
+2.964
26.23%
jan 1, 2003
16.261
+1.997
14.0%
jan 1, 2004
13.126
-3.136
-19.28%
jan 1, 2005
11.772
-1.353
-10.31%
jan 1, 2006
10.088
-1.685
-14.31%
jan 1, 2007
10.354
+0.267
2.64%
jan 1, 2008
10.206
-0.149
-1.44%
jan 1, 2009
10.069
-0.136
-1.34%
jan 1, 2010
9.838
-0.231
-2.3%
jan 1, 2011
10.078
+0.24
2.44%
jan 1, 2012
9.757
-0.32
-3.18%
jan 1, 2013
9.679
-0.079
-0.8%
jan 1, 2014
9.725
+0.046
0.47%
jan 1, 2015
9.85
+0.126
1.29%
Ranking of countries by current statistics by years


Comments: