29
/
en
AIzaSyAYiBZKx7MnpbEhh9jyipgxe19OcubqV5w
April 1, 2024
240173
Singapore
SGP
true
2
1
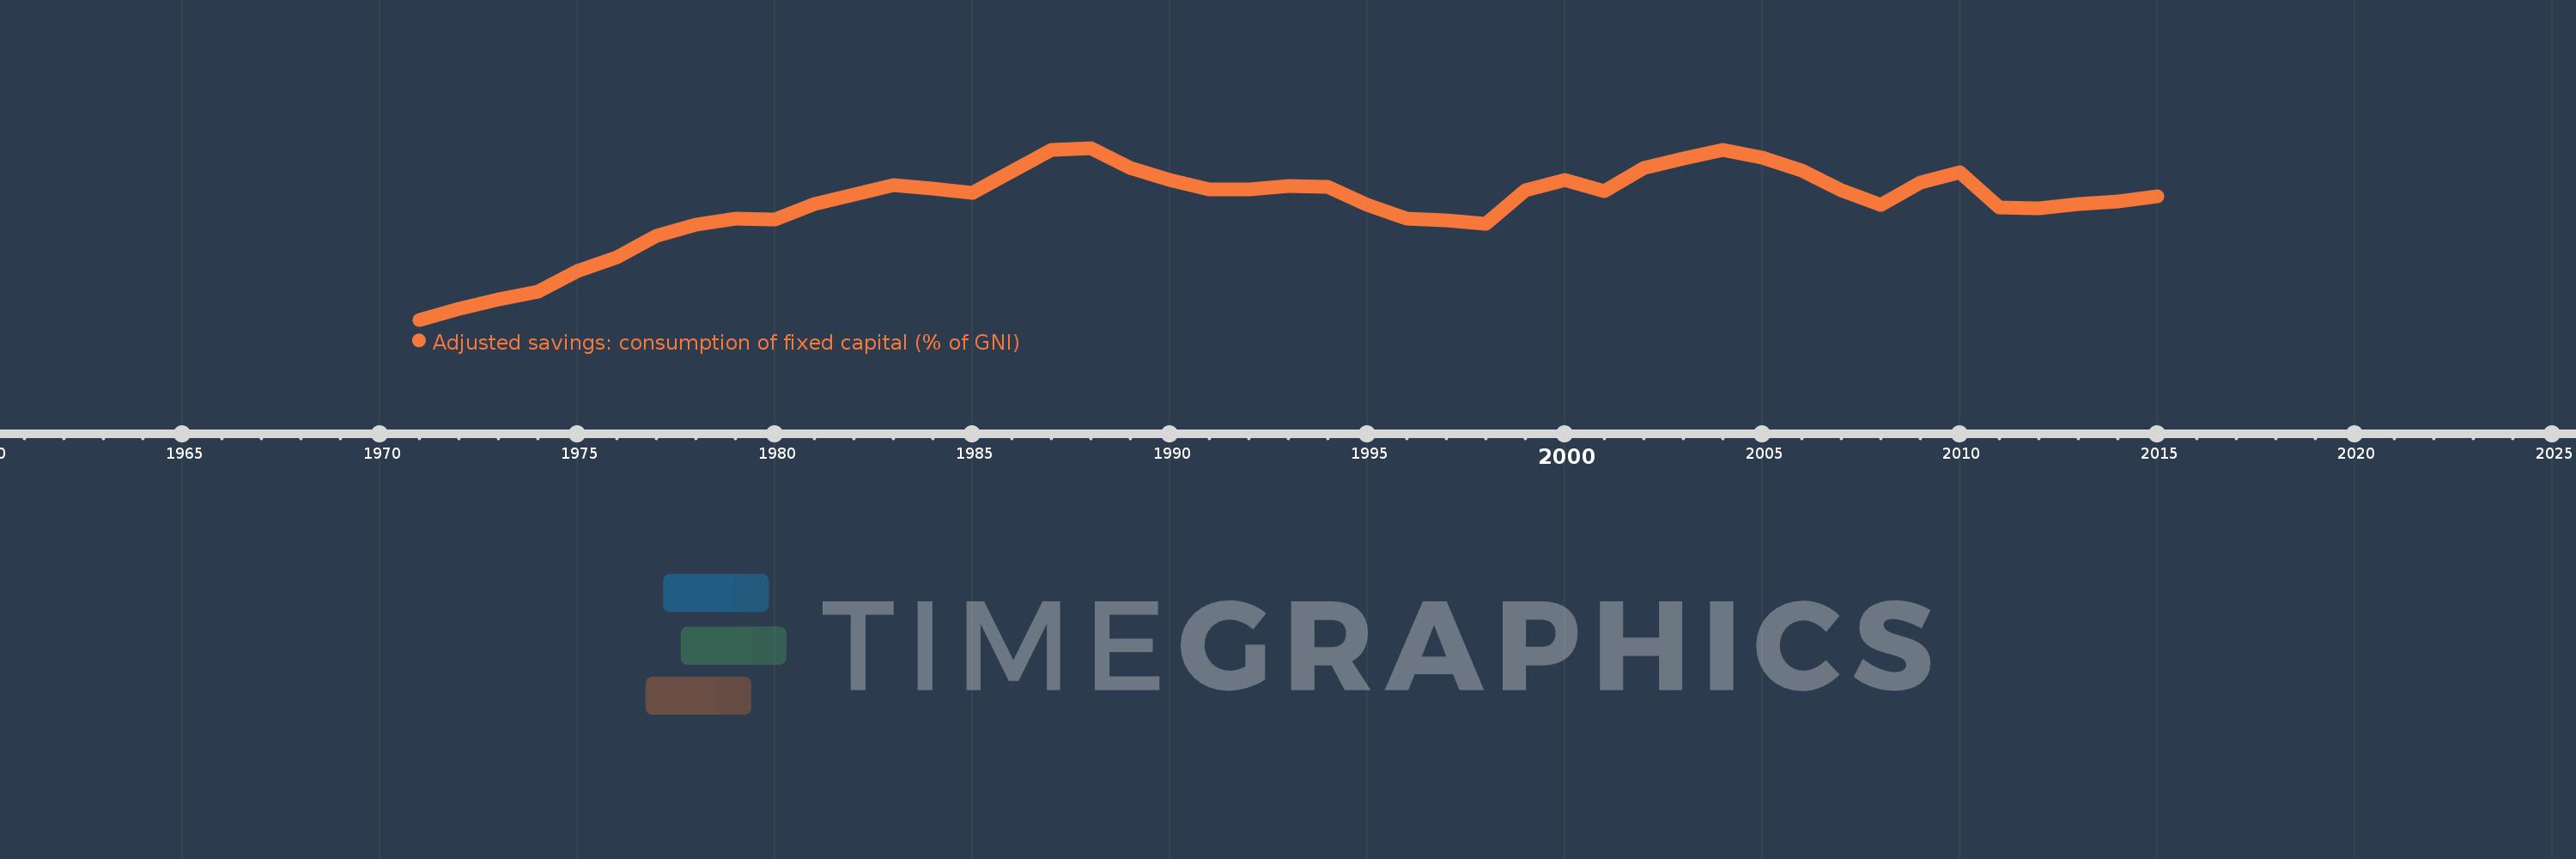
Adjusted savings: consumption of fixed capital (% of GNI)
2015,2014,2013,2012,2011,2010,2009,2008,2007,2006,2005,2004,2003,2002,2001,2000,1999,1998,1997,1996,1995,1994,1993,1992,1991,1990,1989,1988,1987,1986,1985,1984,1983,1982,1981,1980,1979,1978,1977,1976,1975,1974,1973,1972,1971
This statistics in other country:
AfghanistanAlbaniaAlgeriaAndorraAngolaAntigua and BarbudaArab WorldArgentinaArmeniaAustraliaAustriaAzerbaijanBahamas, TheBahrainBangladeshBarbadosBelarusBelgiumBelizeBeninBermudaBhutanBoliviaBosnia and HerzegovinaBotswanaBrazilBrunei DarussalamBulgariaBurkina FasoBurundiCabo VerdeCambodiaCameroonCanadaCaribbean small statesCentral African RepublicCentral Europe and the BalticsChadChileChinaColombiaComorosCongo, Dem. Rep.Congo, Rep.Costa RicaCote d'IvoireCroatiaCubaCyprusCzech RepublicDenmarkDjiboutiDominicaDominican RepublicEarly-demographic dividendEast Asia & PacificEast Asia & Pacific (excluding high income)East Asia & Pacific (IDA & IBRD countries)EcuadorEgypt, Arab Rep.El SalvadorEquatorial GuineaEritreaEstoniaEthiopiaEuro areaEurope & Central AsiaEurope & Central Asia (excluding high income)Europe & Central Asia (IDA & IBRD countries)European UnionFijiFinlandFragile and conflict affected situationsFranceGabonGambia, TheGeorgiaGermanyGhanaGreeceGreenlandGrenadaGuatemalaGuineaGuinea-BissauGuyanaHaitiHeavily indebted poor countries (HIPC)High incomeHondurasHong Kong SAR, ChinaHungaryIBRD onlyIcelandIDA & IBRD totalIDA blendIDA onlyIDA totalIndiaIndonesiaIran, Islamic Rep.IraqIrelandIsraelItalyJamaicaJapanJordanKazakhstanKenyaKiribatiKorea, Rep.KosovoKuwaitKyrgyz RepublicLao PDRLate-demographic dividendLatin America & Caribbean Latin America & Caribbean (excluding high income)Latin America & the Caribbean (IDA & IBRD countries)LatviaLeast developed countries: UN classificationLebanonLesothoLiberiaLibyaLiechtensteinLithuaniaLow & middle incomeLow incomeLower middle incomeLuxembourgMacao SAR, ChinaMacedonia, FYRMadagascarMalawiMalaysiaMaldivesMaliMaltaMarshall IslandsMauritaniaMauritiusMexicoMicronesia, Fed. Sts.Middle East & North AfricaMiddle East & North Africa (excluding high income)Middle East & North Africa (IDA & IBRD countries)Middle incomeMoldovaMonacoMongoliaMontenegroMoroccoMozambiqueMyanmarNamibiaNepalNetherlandsNew ZealandNicaraguaNigerNigeriaNorth AmericaNorwayOECD membersOmanOther small statesPacific island small statesPakistanPalauPanamaPapua New GuineaParaguayPeruPhilippinesPolandPortugalPost-demographic dividendPre-demographic dividendPuerto RicoQatarRomaniaRussian FederationRwandaSamoaSan MarinoSao Tome and PrincipeSaudi ArabiaSenegalSerbiaSeychellesSierra LeoneSingaporeSlovak RepublicSloveniaSmall statesSolomon IslandsSouth AfricaSouth AsiaSouth Asia (IDA & IBRD)SpainSri LankaSt. Kitts and NevisSt. LuciaSt. Vincent and the GrenadinesSub-Saharan Africa Sub-Saharan Africa (excluding high income)Sub-Saharan Africa (IDA & IBRD countries)SudanSurinameSwazilandSwedenSwitzerlandSyrian Arab RepublicTajikistanTanzaniaThailandTimor-LesteTogoTongaTrinidad and TobagoTunisiaTurkeyTurkmenistanTuvaluUgandaUkraineUnited Arab EmiratesUnited KingdomUnited StatesUpper middle incomeUruguayUzbekistanVanuatuVenezuela, RBVietnamWest Bank and GazaWorldYemen, Rep.ZambiaZimbabwe Timeline:
This timeline shows a graph from 1971 to 2015 of Singapore. No data until 1970. Number of actual observations by date: 45.
Source name:
World Development Indicators
Source organization:
World Bank staff estimates using data from the United Nations Statistics Division's National Accounts Statistics.
Categories, topics:
Economy & Growth, Environment
Last updated:
apr 23, 2017
Indicators value changes by year
Maximum:
16.795
jan 1, 1988
At the date of observation
Value
Absolute change
Change from previous value
jan 1, 1971
6.163
+6.163
0.0%
jan 1, 1972
6.855
+0.692
11.23%
jan 1, 1973
7.42
+0.565
8.24%
jan 1, 1974
7.919
+0.499
6.73%
jan 1, 1975
9.178
+1.258
15.89%
jan 1, 1976
10.037
+0.86
9.37%
jan 1, 1977
11.332
+1.295
12.9%
jan 1, 1978
12.061
+0.729
6.43%
jan 1, 1979
12.408
+0.347
2.88%
jan 1, 1980
12.355
-0.052
-0.42%
jan 1, 1981
13.335
+0.98
7.93%
jan 1, 1982
13.917
+0.581
4.36%
jan 1, 1983
14.48
+0.564
4.05%
jan 1, 1984
14.299
-0.181
-1.25%
jan 1, 1985
14.019
-0.281
-1.96%
jan 1, 1986
15.347
+1.328
9.47%
jan 1, 1987
16.671
+1.324
8.63%
jan 1, 1988
16.795
+0.124
0.74%
jan 1, 1989
15.561
-1.234
-7.35%
jan 1, 1990
14.823
-0.738
-4.74%
jan 1, 1991
14.218
-0.605
-4.08%
jan 1, 1992
14.203
-0.015
-0.11%
jan 1, 1993
14.418
+0.215
1.51%
jan 1, 1994
14.396
-0.022
-0.15%
jan 1, 1995
13.254
-1.142
-7.94%
jan 1, 1996
12.439
-0.815
-6.15%
jan 1, 1997
12.335
-0.104
-0.84%
jan 1, 1998
12.116
-0.219
-1.78%
jan 1, 1999
14.198
+2.083
17.19%
jan 1, 2000
14.813
+0.615
4.33%
jan 1, 2001
14.095
-0.718
-4.84%
jan 1, 2002
15.533
+1.438
10.2%
jan 1, 2003
16.123
+0.59
3.8%
jan 1, 2004
16.692
+0.569
3.53%
jan 1, 2005
16.196
-0.496
-2.97%
jan 1, 2006
15.383
-0.813
-5.02%
jan 1, 2007
14.182
-1.201
-7.81%
jan 1, 2008
13.295
-0.886
-6.25%
jan 1, 2009
14.632
+1.337
10.05%
jan 1, 2010
15.317
+0.685
4.68%
jan 1, 2011
13.093
-2.224
-14.52%
jan 1, 2012
13.042
-0.052
-0.4%
jan 1, 2013
13.337
+0.295
2.26%
jan 1, 2014
13.475
+0.138
1.03%
jan 1, 2015
13.823
+0.348
2.58%
Ranking of countries by current statistics by years


Comments: