29
/
en
AIzaSyAYiBZKx7MnpbEhh9jyipgxe19OcubqV5w
April 1, 2024
37908
IDA blend
IDB
false
2
1
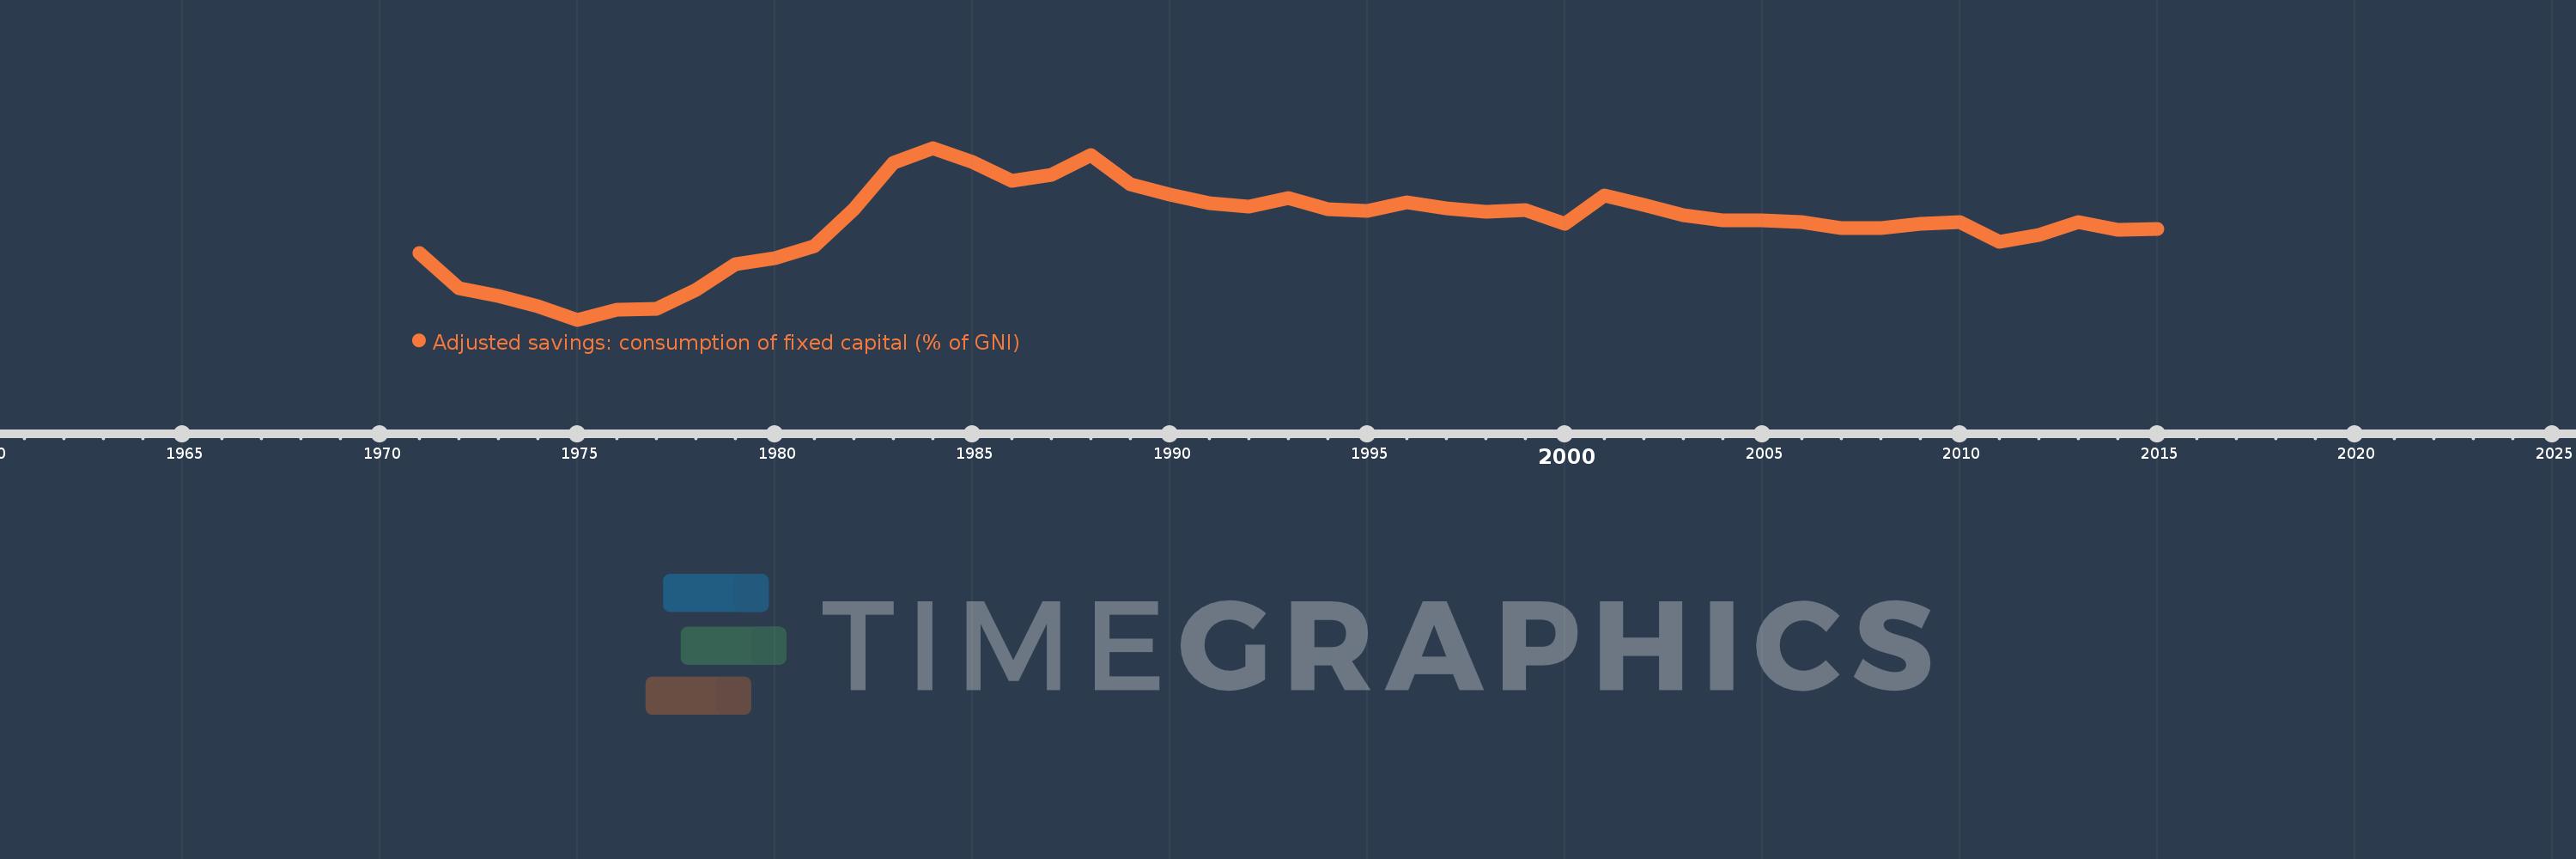
Adjusted savings: consumption of fixed capital (% of GNI)
2015,2014,2013,2012,2011,2010,2009,2008,2007,2006,2005,2004,2003,2002,2001,2000,1999,1998,1997,1996,1995,1994,1993,1992,1991,1990,1989,1988,1987,1986,1985,1984,1983,1982,1981,1980,1979,1978,1977,1976,1975,1974,1973,1972,1971
This statistics in other country:
AfghanistanAlbaniaAlgeriaAndorraAngolaAntigua and BarbudaArab WorldArgentinaArmeniaAustraliaAustriaAzerbaijanBahamas, TheBahrainBangladeshBarbadosBelarusBelgiumBelizeBeninBermudaBhutanBoliviaBosnia and HerzegovinaBotswanaBrazilBrunei DarussalamBulgariaBurkina FasoBurundiCabo VerdeCambodiaCameroonCanadaCaribbean small statesCentral African RepublicCentral Europe and the BalticsChadChileChinaColombiaComorosCongo, Dem. Rep.Congo, Rep.Costa RicaCote d'IvoireCroatiaCubaCyprusCzech RepublicDenmarkDjiboutiDominicaDominican RepublicEarly-demographic dividendEast Asia & PacificEast Asia & Pacific (excluding high income)East Asia & Pacific (IDA & IBRD countries)EcuadorEgypt, Arab Rep.El SalvadorEquatorial GuineaEritreaEstoniaEthiopiaEuro areaEurope & Central AsiaEurope & Central Asia (excluding high income)Europe & Central Asia (IDA & IBRD countries)European UnionFijiFinlandFragile and conflict affected situationsFranceGabonGambia, TheGeorgiaGermanyGhanaGreeceGreenlandGrenadaGuatemalaGuineaGuinea-BissauGuyanaHaitiHeavily indebted poor countries (HIPC)High incomeHondurasHong Kong SAR, ChinaHungaryIBRD onlyIcelandIDA & IBRD totalIDA blendIDA onlyIDA totalIndiaIndonesiaIran, Islamic Rep.IraqIrelandIsraelItalyJamaicaJapanJordanKazakhstanKenyaKiribatiKorea, Rep.KosovoKuwaitKyrgyz RepublicLao PDRLate-demographic dividendLatin America & Caribbean Latin America & Caribbean (excluding high income)Latin America & the Caribbean (IDA & IBRD countries)LatviaLeast developed countries: UN classificationLebanonLesothoLiberiaLibyaLiechtensteinLithuaniaLow & middle incomeLow incomeLower middle incomeLuxembourgMacao SAR, ChinaMacedonia, FYRMadagascarMalawiMalaysiaMaldivesMaliMaltaMarshall IslandsMauritaniaMauritiusMexicoMicronesia, Fed. Sts.Middle East & North AfricaMiddle East & North Africa (excluding high income)Middle East & North Africa (IDA & IBRD countries)Middle incomeMoldovaMonacoMongoliaMontenegroMoroccoMozambiqueMyanmarNamibiaNepalNetherlandsNew ZealandNicaraguaNigerNigeriaNorth AmericaNorwayOECD membersOmanOther small statesPacific island small statesPakistanPalauPanamaPapua New GuineaParaguayPeruPhilippinesPolandPortugalPost-demographic dividendPre-demographic dividendPuerto RicoQatarRomaniaRussian FederationRwandaSamoaSan MarinoSao Tome and PrincipeSaudi ArabiaSenegalSerbiaSeychellesSierra LeoneSingaporeSlovak RepublicSloveniaSmall statesSolomon IslandsSouth AfricaSouth AsiaSouth Asia (IDA & IBRD)SpainSri LankaSt. Kitts and NevisSt. LuciaSt. Vincent and the GrenadinesSub-Saharan Africa Sub-Saharan Africa (excluding high income)Sub-Saharan Africa (IDA & IBRD countries)SudanSurinameSwazilandSwedenSwitzerlandSyrian Arab RepublicTajikistanTanzaniaThailandTimor-LesteTogoTongaTrinidad and TobagoTunisiaTurkeyTurkmenistanTuvaluUgandaUkraineUnited Arab EmiratesUnited KingdomUnited StatesUpper middle incomeUruguayUzbekistanVanuatuVenezuela, RBVietnamWest Bank and GazaWorldYemen, Rep.ZambiaZimbabwe Timeline:
This timeline shows a graph from 1971 to 2015 of IDA blend. No data until 1970. Number of actual observations by date: 45.
Source name:
World Development Indicators
Source organization:
World Bank staff estimates using data from the United Nations Statistics Division's National Accounts Statistics.
Categories, topics:
Economy & Growth, Environment
Last updated:
apr 23, 2017
Indicators value changes by year
At the date of observation
Value
Absolute change
Change from previous value
jan 1, 1971
6.319
+6.319
0.0%
jan 1, 1972
5.391
-0.928
-14.68%
jan 1, 1973
5.175
-0.216
-4.0%
jan 1, 1974
4.902
-0.274
-5.29%
jan 1, 1975
4.547
-0.355
-7.24%
jan 1, 1976
4.826
+0.279
6.13%
jan 1, 1977
4.837
+0.011
0.23%
jan 1, 1978
5.349
+0.512
10.58%
jan 1, 1979
6.024
+0.676
12.63%
jan 1, 1980
6.186
+0.162
2.68%
jan 1, 1981
6.511
+0.325
5.26%
jan 1, 1982
7.488
+0.976
14.99%
jan 1, 1983
8.725
+1.237
16.52%
jan 1, 1984
9.131
+0.406
4.66%
jan 1, 1985
8.751
-0.379
-4.16%
jan 1, 1986
8.248
-0.504
-5.75%
jan 1, 1987
8.417
+0.169
2.05%
jan 1, 1988
8.937
+0.52
6.18%
jan 1, 1989
8.159
-0.778
-8.7%
jan 1, 1990
7.885
-0.274
-3.36%
jan 1, 1991
7.659
-0.226
-2.87%
jan 1, 1992
7.56
-0.099
-1.3%
jan 1, 1993
7.798
+0.238
3.15%
jan 1, 1994
7.496
-0.302
-3.88%
jan 1, 1995
7.443
-0.053
-0.71%
jan 1, 1996
7.676
+0.234
3.14%
jan 1, 1997
7.514
-0.163
-2.12%
jan 1, 1998
7.419
-0.094
-1.25%
jan 1, 1999
7.485
+0.066
0.89%
jan 1, 2000
7.103
-0.382
-5.1%
jan 1, 2001
7.859
+0.756
10.64%
jan 1, 2002
7.621
-0.238
-3.02%
jan 1, 2003
7.332
-0.289
-3.79%
jan 1, 2004
7.193
-0.139
-1.9%
jan 1, 2005
7.207
+0.013
0.19%
jan 1, 2006
7.155
-0.051
-0.71%
jan 1, 2007
6.995
-0.16
-2.24%
jan 1, 2008
6.991
-0.004
-0.05%
jan 1, 2009
7.109
+0.117
1.68%
jan 1, 2010
7.15
+0.041
0.57%
jan 1, 2011
6.628
-0.521
-7.29%
jan 1, 2012
6.817
+0.188
2.84%
jan 1, 2013
7.158
+0.342
5.01%
jan 1, 2014
6.94
-0.219
-3.06%
jan 1, 2015
6.96
+0.02
0.29%
Ranking of countries by current statistics by years


Comments: