29
/
en
AIzaSyAYiBZKx7MnpbEhh9jyipgxe19OcubqV5w
April 1, 2024
211298
Niger
NER
true
2
1
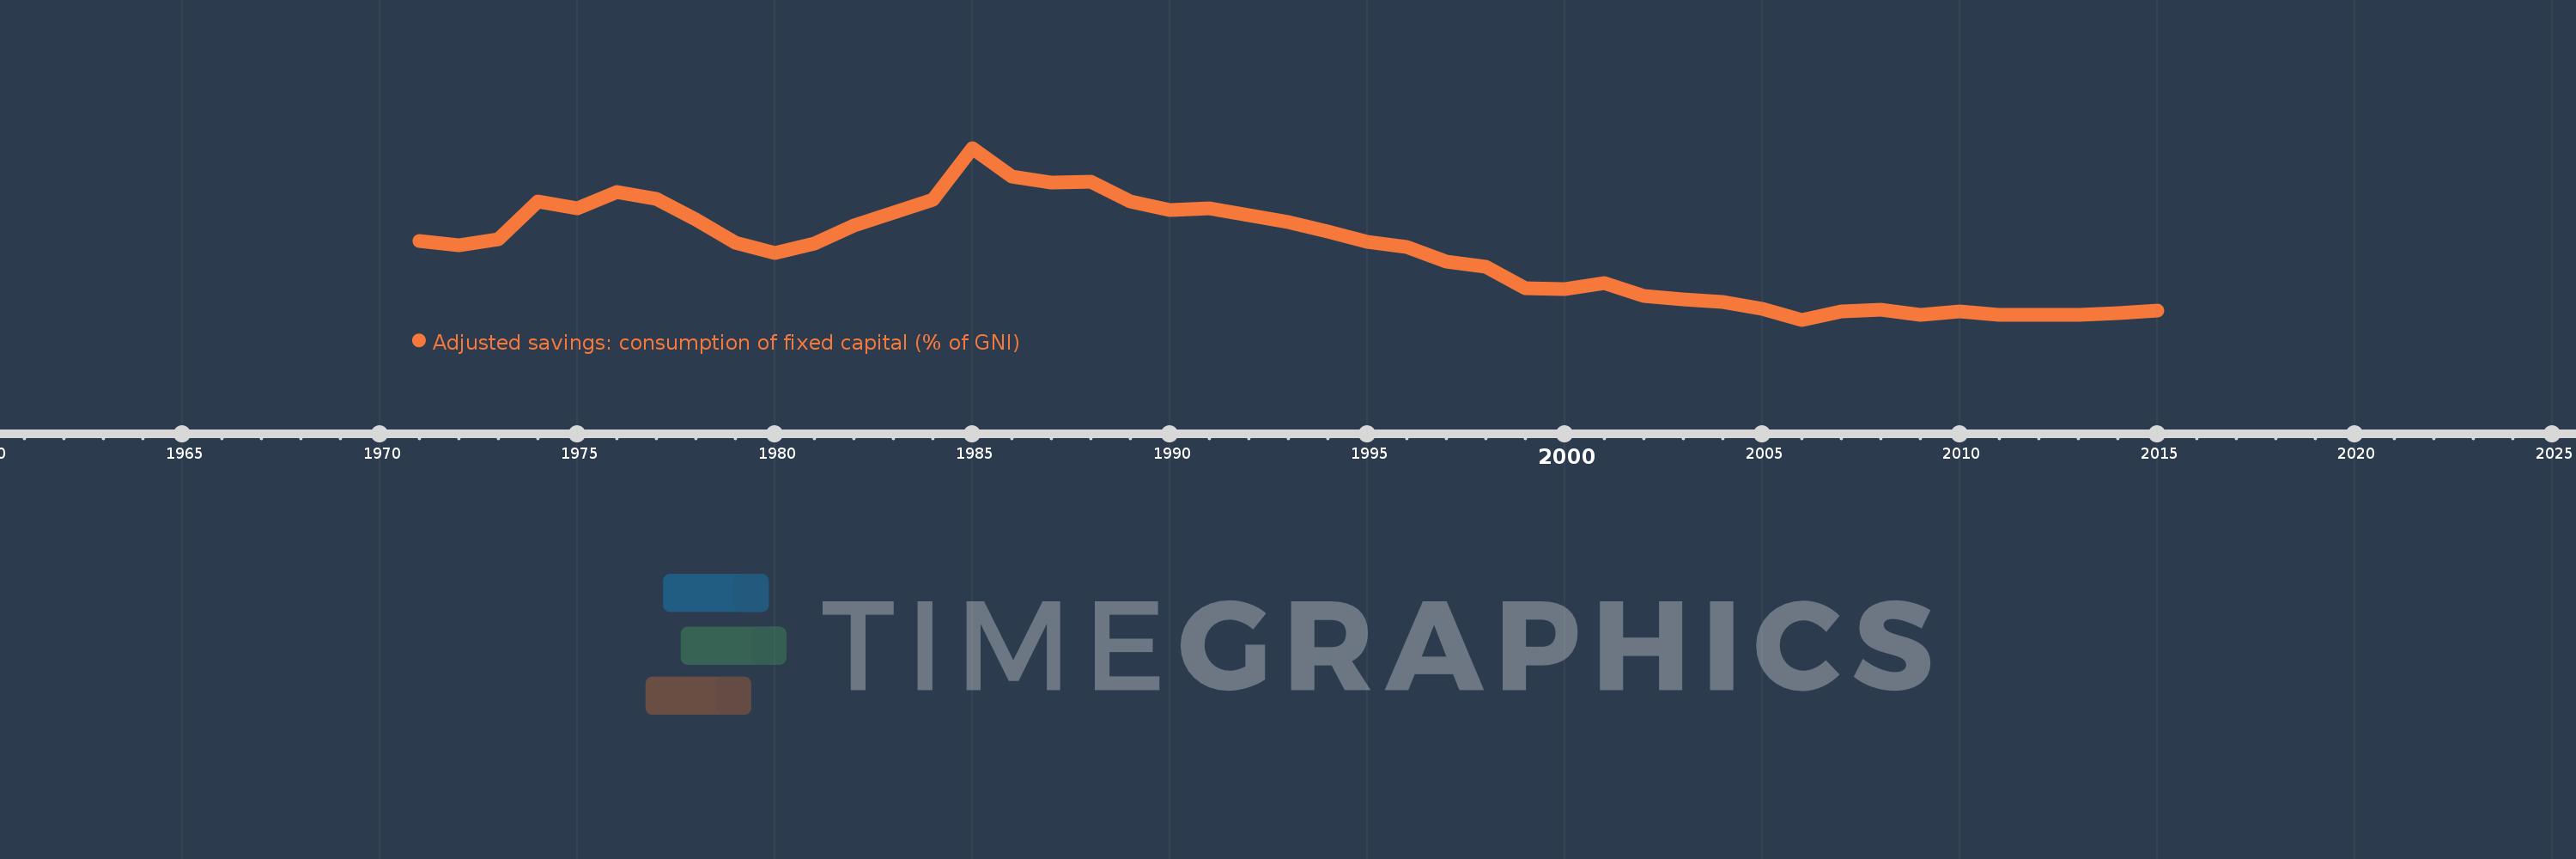
Adjusted savings: consumption of fixed capital (% of GNI)
2015,2014,2013,2012,2011,2010,2009,2008,2007,2006,2005,2004,2003,2002,2001,2000,1999,1998,1997,1996,1995,1994,1993,1992,1991,1990,1989,1988,1987,1986,1985,1984,1983,1982,1981,1980,1979,1978,1977,1976,1975,1974,1973,1972,1971
This statistics in other country:
AfghanistanAlbaniaAlgeriaAndorraAngolaAntigua and BarbudaArab WorldArgentinaArmeniaAustraliaAustriaAzerbaijanBahamas, TheBahrainBangladeshBarbadosBelarusBelgiumBelizeBeninBermudaBhutanBoliviaBosnia and HerzegovinaBotswanaBrazilBrunei DarussalamBulgariaBurkina FasoBurundiCabo VerdeCambodiaCameroonCanadaCaribbean small statesCentral African RepublicCentral Europe and the BalticsChadChileChinaColombiaComorosCongo, Dem. Rep.Congo, Rep.Costa RicaCote d'IvoireCroatiaCubaCyprusCzech RepublicDenmarkDjiboutiDominicaDominican RepublicEarly-demographic dividendEast Asia & PacificEast Asia & Pacific (excluding high income)East Asia & Pacific (IDA & IBRD countries)EcuadorEgypt, Arab Rep.El SalvadorEquatorial GuineaEritreaEstoniaEthiopiaEuro areaEurope & Central AsiaEurope & Central Asia (excluding high income)Europe & Central Asia (IDA & IBRD countries)European UnionFijiFinlandFragile and conflict affected situationsFranceGabonGambia, TheGeorgiaGermanyGhanaGreeceGreenlandGrenadaGuatemalaGuineaGuinea-BissauGuyanaHaitiHeavily indebted poor countries (HIPC)High incomeHondurasHong Kong SAR, ChinaHungaryIBRD onlyIcelandIDA & IBRD totalIDA blendIDA onlyIDA totalIndiaIndonesiaIran, Islamic Rep.IraqIrelandIsraelItalyJamaicaJapanJordanKazakhstanKenyaKiribatiKorea, Rep.KosovoKuwaitKyrgyz RepublicLao PDRLate-demographic dividendLatin America & Caribbean Latin America & Caribbean (excluding high income)Latin America & the Caribbean (IDA & IBRD countries)LatviaLeast developed countries: UN classificationLebanonLesothoLiberiaLibyaLiechtensteinLithuaniaLow & middle incomeLow incomeLower middle incomeLuxembourgMacao SAR, ChinaMacedonia, FYRMadagascarMalawiMalaysiaMaldivesMaliMaltaMarshall IslandsMauritaniaMauritiusMexicoMicronesia, Fed. Sts.Middle East & North AfricaMiddle East & North Africa (excluding high income)Middle East & North Africa (IDA & IBRD countries)Middle incomeMoldovaMonacoMongoliaMontenegroMoroccoMozambiqueMyanmarNamibiaNepalNetherlandsNew ZealandNicaraguaNigerNigeriaNorth AmericaNorwayOECD membersOmanOther small statesPacific island small statesPakistanPalauPanamaPapua New GuineaParaguayPeruPhilippinesPolandPortugalPost-demographic dividendPre-demographic dividendPuerto RicoQatarRomaniaRussian FederationRwandaSamoaSan MarinoSao Tome and PrincipeSaudi ArabiaSenegalSerbiaSeychellesSierra LeoneSingaporeSlovak RepublicSloveniaSmall statesSolomon IslandsSouth AfricaSouth AsiaSouth Asia (IDA & IBRD)SpainSri LankaSt. Kitts and NevisSt. LuciaSt. Vincent and the GrenadinesSub-Saharan Africa Sub-Saharan Africa (excluding high income)Sub-Saharan Africa (IDA & IBRD countries)SudanSurinameSwazilandSwedenSwitzerlandSyrian Arab RepublicTajikistanTanzaniaThailandTimor-LesteTogoTongaTrinidad and TobagoTunisiaTurkeyTurkmenistanTuvaluUgandaUkraineUnited Arab EmiratesUnited KingdomUnited StatesUpper middle incomeUruguayUzbekistanVanuatuVenezuela, RBVietnamWest Bank and GazaWorldYemen, Rep.ZambiaZimbabwe Timeline:
This timeline shows a graph from 1971 to 2015 of Niger. No data until 1970. Number of actual observations by date: 45.
Source name:
World Development Indicators
Source organization:
World Bank staff estimates using data from the United Nations Statistics Division's National Accounts Statistics.
Categories, topics:
Economy & Growth, Environment
Last updated:
apr 23, 2017
Indicators value changes by year
Maximum:
19.362
jan 1, 1985
At the date of observation
Value
Absolute change
Change from previous value
jan 1, 1971
10.265
+10.265
0.0%
jan 1, 1972
9.778
-0.487
-4.74%
jan 1, 1973
10.428
+0.65
6.64%
jan 1, 1974
14.138
+3.71
35.57%
jan 1, 1975
13.474
-0.664
-4.7%
jan 1, 1976
15.028
+1.555
11.54%
jan 1, 1977
14.328
-0.7
-4.66%
jan 1, 1978
12.375
-1.952
-13.63%
jan 1, 1979
10.066
-2.309
-18.66%
jan 1, 1980
9.044
-1.022
-10.15%
jan 1, 1981
9.939
+0.895
9.9%
jan 1, 1982
11.709
+1.77
17.81%
jan 1, 1983
13.054
+1.345
11.49%
jan 1, 1984
14.254
+1.2
9.19%
jan 1, 1985
19.362
+5.108
35.84%
jan 1, 1986
16.532
-2.829
-14.61%
jan 1, 1987
15.99
-0.542
-3.28%
jan 1, 1988
16.032
+0.042
0.26%
jan 1, 1989
14.068
-1.964
-12.25%
jan 1, 1990
13.229
-0.839
-5.97%
jan 1, 1991
13.453
+0.224
1.69%
jan 1, 1992
12.778
-0.675
-5.01%
jan 1, 1993
12.045
-0.733
-5.74%
jan 1, 1994
11.19
-0.855
-7.1%
jan 1, 1995
10.166
-1.024
-9.15%
jan 1, 1996
9.605
-0.561
-5.52%
jan 1, 1997
8.239
-1.366
-14.22%
jan 1, 1998
7.671
-0.568
-6.89%
jan 1, 1999
5.6
-2.071
-26.99%
jan 1, 2000
5.533
-0.067
-1.2%
jan 1, 2001
6.127
+0.594
10.73%
jan 1, 2002
4.824
-1.303
-21.27%
jan 1, 2003
4.496
-0.328
-6.79%
jan 1, 2004
4.278
-0.218
-4.84%
jan 1, 2005
3.582
-0.696
-16.28%
jan 1, 2006
2.499
-1.083
-30.24%
jan 1, 2007
3.281
+0.782
31.29%
jan 1, 2008
3.517
+0.236
7.19%
jan 1, 2009
3.009
-0.508
-14.45%
jan 1, 2010
3.351
+0.343
11.4%
jan 1, 2011
2.954
-0.397
-11.86%
jan 1, 2012
2.973
+0.018
0.63%
jan 1, 2013
3.007
+0.035
1.17%
jan 1, 2014
3.149
+0.142
4.71%
jan 1, 2015
3.409
+0.26
8.25%
Ranking of countries by current statistics by years


Comments: