29
/
en
AIzaSyAYiBZKx7MnpbEhh9jyipgxe19OcubqV5w
April 1, 2024
99487
Cameroon
CMR
true
2
1
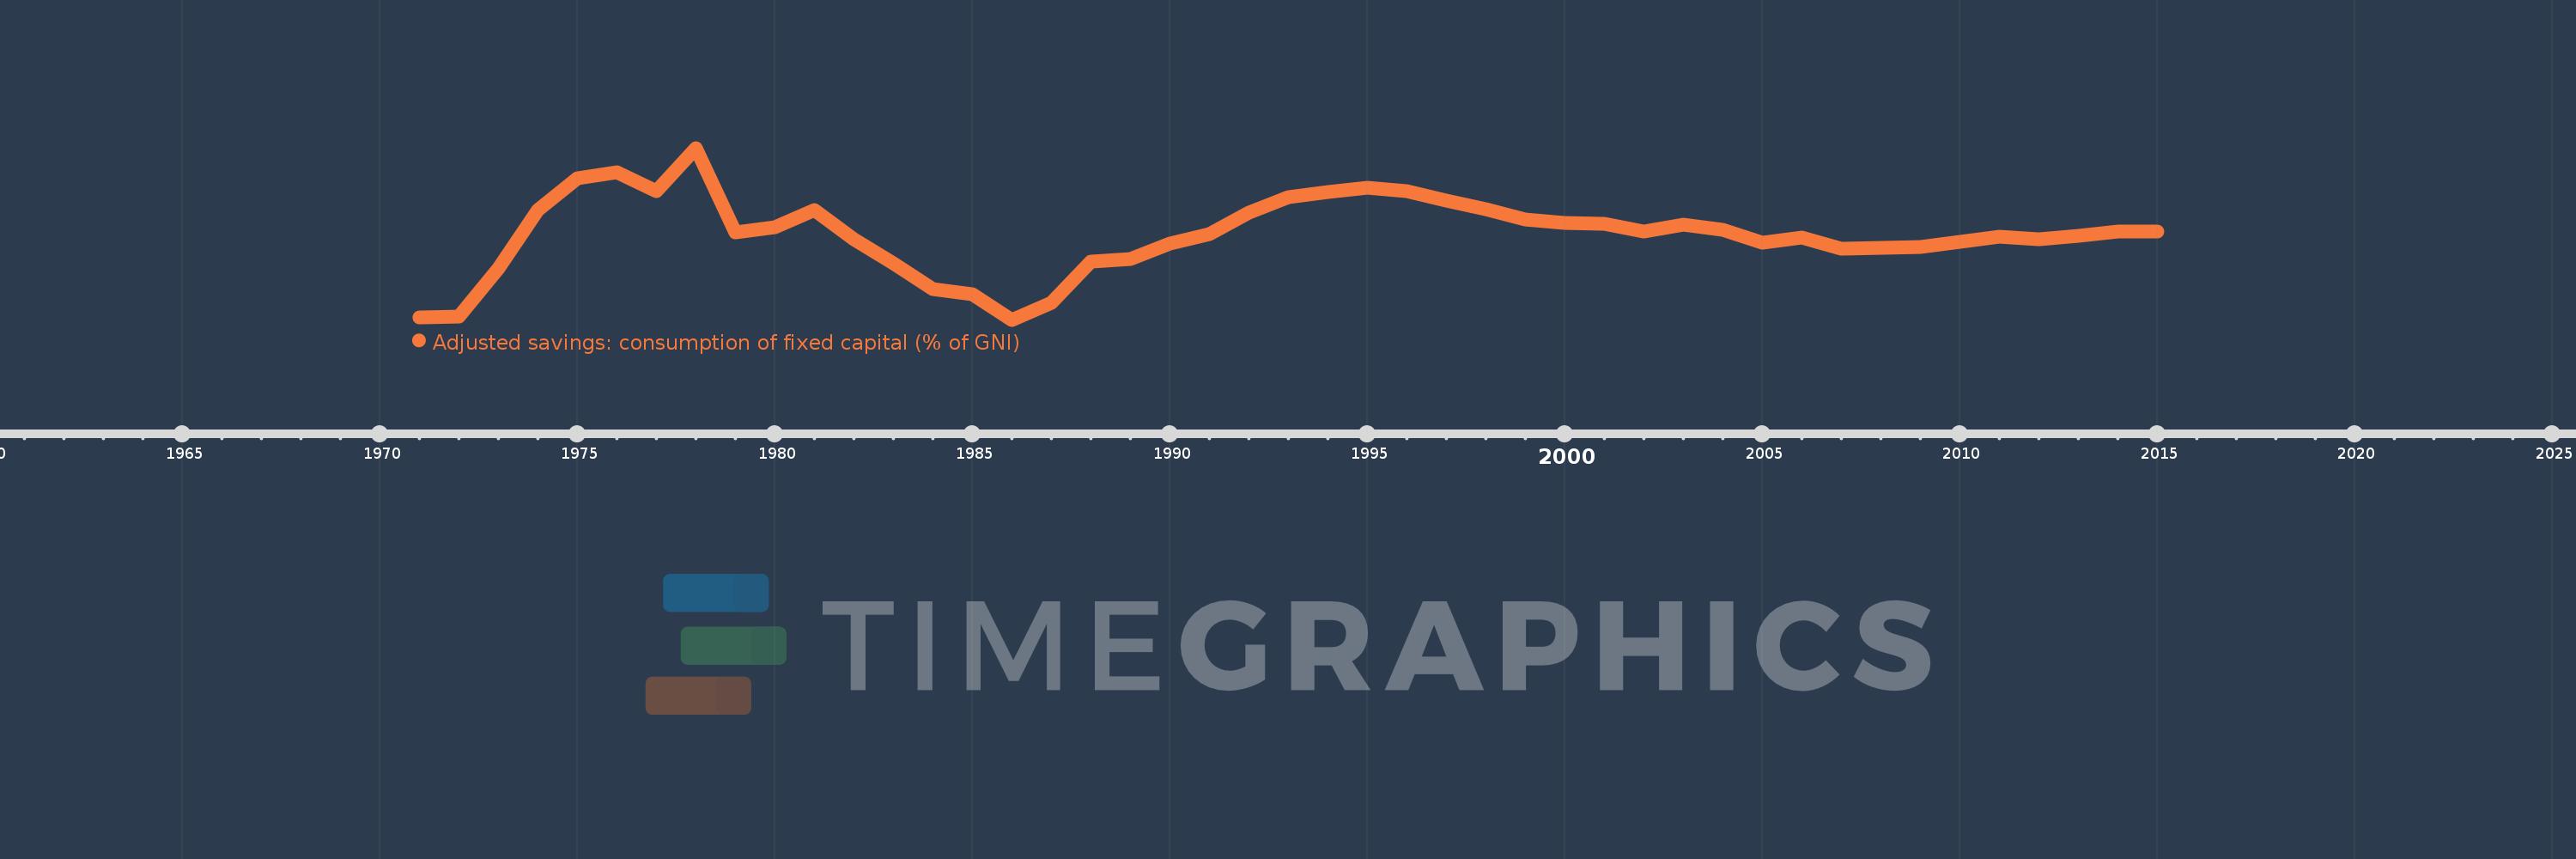
Adjusted savings: consumption of fixed capital (% of GNI)
2015,2014,2013,2012,2011,2010,2009,2008,2007,2006,2005,2004,2003,2002,2001,2000,1999,1998,1997,1996,1995,1994,1993,1992,1991,1990,1989,1988,1987,1986,1985,1984,1983,1982,1981,1980,1979,1978,1977,1976,1975,1974,1973,1972,1971
This statistics in other country:
AfghanistanAlbaniaAlgeriaAndorraAngolaAntigua and BarbudaArab WorldArgentinaArmeniaAustraliaAustriaAzerbaijanBahamas, TheBahrainBangladeshBarbadosBelarusBelgiumBelizeBeninBermudaBhutanBoliviaBosnia and HerzegovinaBotswanaBrazilBrunei DarussalamBulgariaBurkina FasoBurundiCabo VerdeCambodiaCameroonCanadaCaribbean small statesCentral African RepublicCentral Europe and the BalticsChadChileChinaColombiaComorosCongo, Dem. Rep.Congo, Rep.Costa RicaCote d'IvoireCroatiaCubaCyprusCzech RepublicDenmarkDjiboutiDominicaDominican RepublicEarly-demographic dividendEast Asia & PacificEast Asia & Pacific (excluding high income)East Asia & Pacific (IDA & IBRD countries)EcuadorEgypt, Arab Rep.El SalvadorEquatorial GuineaEritreaEstoniaEthiopiaEuro areaEurope & Central AsiaEurope & Central Asia (excluding high income)Europe & Central Asia (IDA & IBRD countries)European UnionFijiFinlandFragile and conflict affected situationsFranceGabonGambia, TheGeorgiaGermanyGhanaGreeceGreenlandGrenadaGuatemalaGuineaGuinea-BissauGuyanaHaitiHeavily indebted poor countries (HIPC)High incomeHondurasHong Kong SAR, ChinaHungaryIBRD onlyIcelandIDA & IBRD totalIDA blendIDA onlyIDA totalIndiaIndonesiaIran, Islamic Rep.IraqIrelandIsraelItalyJamaicaJapanJordanKazakhstanKenyaKiribatiKorea, Rep.KosovoKuwaitKyrgyz RepublicLao PDRLate-demographic dividendLatin America & Caribbean Latin America & Caribbean (excluding high income)Latin America & the Caribbean (IDA & IBRD countries)LatviaLeast developed countries: UN classificationLebanonLesothoLiberiaLibyaLiechtensteinLithuaniaLow & middle incomeLow incomeLower middle incomeLuxembourgMacao SAR, ChinaMacedonia, FYRMadagascarMalawiMalaysiaMaldivesMaliMaltaMarshall IslandsMauritaniaMauritiusMexicoMicronesia, Fed. Sts.Middle East & North AfricaMiddle East & North Africa (excluding high income)Middle East & North Africa (IDA & IBRD countries)Middle incomeMoldovaMonacoMongoliaMontenegroMoroccoMozambiqueMyanmarNamibiaNepalNetherlandsNew ZealandNicaraguaNigerNigeriaNorth AmericaNorwayOECD membersOmanOther small statesPacific island small statesPakistanPalauPanamaPapua New GuineaParaguayPeruPhilippinesPolandPortugalPost-demographic dividendPre-demographic dividendPuerto RicoQatarRomaniaRussian FederationRwandaSamoaSan MarinoSao Tome and PrincipeSaudi ArabiaSenegalSerbiaSeychellesSierra LeoneSingaporeSlovak RepublicSloveniaSmall statesSolomon IslandsSouth AfricaSouth AsiaSouth Asia (IDA & IBRD)SpainSri LankaSt. Kitts and NevisSt. LuciaSt. Vincent and the GrenadinesSub-Saharan Africa Sub-Saharan Africa (excluding high income)Sub-Saharan Africa (IDA & IBRD countries)SudanSurinameSwazilandSwedenSwitzerlandSyrian Arab RepublicTajikistanTanzaniaThailandTimor-LesteTogoTongaTrinidad and TobagoTunisiaTurkeyTurkmenistanTuvaluUgandaUkraineUnited Arab EmiratesUnited KingdomUnited StatesUpper middle incomeUruguayUzbekistanVanuatuVenezuela, RBVietnamWest Bank and GazaWorldYemen, Rep.ZambiaZimbabwe Timeline:
This timeline shows a graph from 1971 to 2015 of Cameroon. No data until 1970. Number of actual observations by date: 45.
Source name:
World Development Indicators
Source organization:
World Bank staff estimates using data from the United Nations Statistics Division's National Accounts Statistics.
Categories, topics:
Economy & Growth, Environment
Last updated:
apr 23, 2017
Indicators value changes by year
Maximum:
10.716
jan 1, 1978
At the date of observation
Value
Absolute change
Change from previous value
jan 1, 1971
4.405
+4.405
0.0%
jan 1, 1972
4.439
+0.034
0.78%
jan 1, 1973
6.237
+1.798
40.51%
jan 1, 1974
8.392
+2.155
34.55%
jan 1, 1975
9.576
+1.183
14.1%
jan 1, 1976
9.807
+0.231
2.42%
jan 1, 1977
9.095
-0.712
-7.26%
jan 1, 1978
10.716
+1.621
17.82%
jan 1, 1979
7.588
-3.128
-29.19%
jan 1, 1980
7.754
+0.165
2.18%
jan 1, 1981
8.399
+0.645
8.32%
jan 1, 1982
7.324
-1.075
-12.8%
jan 1, 1983
6.423
-0.901
-12.3%
jan 1, 1984
5.476
-0.947
-14.75%
jan 1, 1985
5.262
-0.214
-3.9%
jan 1, 1986
4.32
-0.942
-17.91%
jan 1, 1987
4.936
+0.617
14.28%
jan 1, 1988
6.485
+1.549
31.37%
jan 1, 1989
6.576
+0.091
1.4%
jan 1, 1990
7.142
+0.566
8.61%
jan 1, 1991
7.498
+0.356
4.98%
jan 1, 1992
8.316
+0.818
10.91%
jan 1, 1993
8.885
+0.569
6.85%
jan 1, 1994
9.08
+0.195
2.2%
jan 1, 1995
9.229
+0.149
1.65%
jan 1, 1996
9.116
-0.113
-1.23%
jan 1, 1997
8.753
-0.363
-3.98%
jan 1, 1998
8.439
-0.314
-3.58%
jan 1, 1999
8.045
-0.394
-4.67%
jan 1, 2000
7.909
-0.136
-1.68%
jan 1, 2001
7.907
-0.002
-0.03%
jan 1, 2002
7.609
-0.298
-3.77%
jan 1, 2003
7.871
+0.262
3.44%
jan 1, 2004
7.661
-0.21
-2.67%
jan 1, 2005
7.185
-0.475
-6.21%
jan 1, 2006
7.377
+0.192
2.67%
jan 1, 2007
6.973
-0.404
-5.47%
jan 1, 2008
7.01
+0.037
0.53%
jan 1, 2009
7.036
+0.025
0.36%
jan 1, 2010
7.226
+0.19
2.7%
jan 1, 2011
7.403
+0.177
2.45%
jan 1, 2012
7.312
-0.091
-1.23%
jan 1, 2013
7.46
+0.148
2.02%
jan 1, 2014
7.599
+0.139
1.87%
jan 1, 2015
7.615
+0.015
0.2%
Ranking of countries by current statistics by years


Comments: