29
/
en
AIzaSyAYiBZKx7MnpbEhh9jyipgxe19OcubqV5w
April 1, 2024
266503
Trinidad and Tobago
TTO
true
2
1
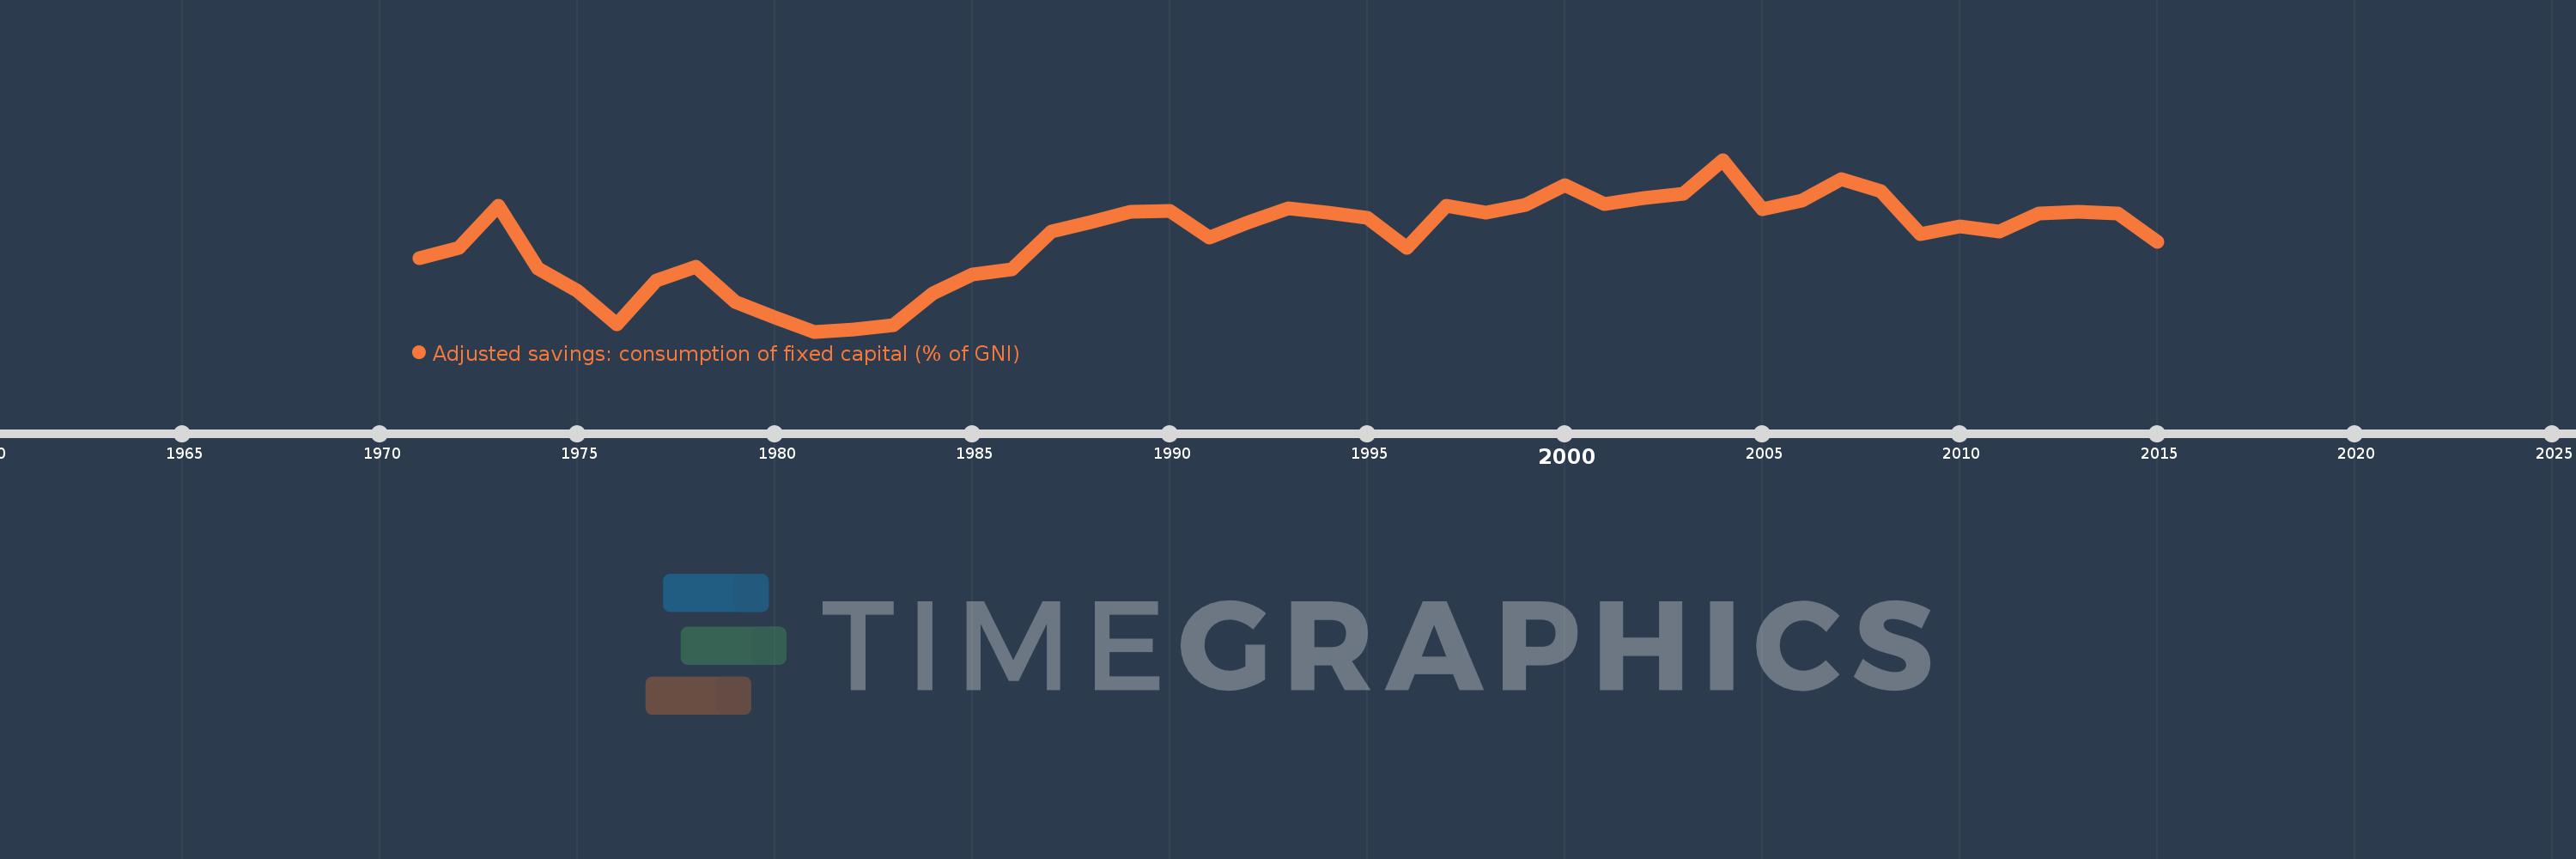
Adjusted savings: consumption of fixed capital (% of GNI)
2015,2014,2013,2012,2011,2010,2009,2008,2007,2006,2005,2004,2003,2002,2001,2000,1999,1998,1997,1996,1995,1994,1993,1992,1991,1990,1989,1988,1987,1986,1985,1984,1983,1982,1981,1980,1979,1978,1977,1976,1975,1974,1973,1972,1971
This statistics in other country:
AfghanistanAlbaniaAlgeriaAndorraAngolaAntigua and BarbudaArab WorldArgentinaArmeniaAustraliaAustriaAzerbaijanBahamas, TheBahrainBangladeshBarbadosBelarusBelgiumBelizeBeninBermudaBhutanBoliviaBosnia and HerzegovinaBotswanaBrazilBrunei DarussalamBulgariaBurkina FasoBurundiCabo VerdeCambodiaCameroonCanadaCaribbean small statesCentral African RepublicCentral Europe and the BalticsChadChileChinaColombiaComorosCongo, Dem. Rep.Congo, Rep.Costa RicaCote d'IvoireCroatiaCubaCyprusCzech RepublicDenmarkDjiboutiDominicaDominican RepublicEarly-demographic dividendEast Asia & PacificEast Asia & Pacific (excluding high income)East Asia & Pacific (IDA & IBRD countries)EcuadorEgypt, Arab Rep.El SalvadorEquatorial GuineaEritreaEstoniaEthiopiaEuro areaEurope & Central AsiaEurope & Central Asia (excluding high income)Europe & Central Asia (IDA & IBRD countries)European UnionFijiFinlandFragile and conflict affected situationsFranceGabonGambia, TheGeorgiaGermanyGhanaGreeceGreenlandGrenadaGuatemalaGuineaGuinea-BissauGuyanaHaitiHeavily indebted poor countries (HIPC)High incomeHondurasHong Kong SAR, ChinaHungaryIBRD onlyIcelandIDA & IBRD totalIDA blendIDA onlyIDA totalIndiaIndonesiaIran, Islamic Rep.IraqIrelandIsraelItalyJamaicaJapanJordanKazakhstanKenyaKiribatiKorea, Rep.KosovoKuwaitKyrgyz RepublicLao PDRLate-demographic dividendLatin America & Caribbean Latin America & Caribbean (excluding high income)Latin America & the Caribbean (IDA & IBRD countries)LatviaLeast developed countries: UN classificationLebanonLesothoLiberiaLibyaLiechtensteinLithuaniaLow & middle incomeLow incomeLower middle incomeLuxembourgMacao SAR, ChinaMacedonia, FYRMadagascarMalawiMalaysiaMaldivesMaliMaltaMarshall IslandsMauritaniaMauritiusMexicoMicronesia, Fed. Sts.Middle East & North AfricaMiddle East & North Africa (excluding high income)Middle East & North Africa (IDA & IBRD countries)Middle incomeMoldovaMonacoMongoliaMontenegroMoroccoMozambiqueMyanmarNamibiaNepalNetherlandsNew ZealandNicaraguaNigerNigeriaNorth AmericaNorwayOECD membersOmanOther small statesPacific island small statesPakistanPalauPanamaPapua New GuineaParaguayPeruPhilippinesPolandPortugalPost-demographic dividendPre-demographic dividendPuerto RicoQatarRomaniaRussian FederationRwandaSamoaSan MarinoSao Tome and PrincipeSaudi ArabiaSenegalSerbiaSeychellesSierra LeoneSingaporeSlovak RepublicSloveniaSmall statesSolomon IslandsSouth AfricaSouth AsiaSouth Asia (IDA & IBRD)SpainSri LankaSt. Kitts and NevisSt. LuciaSt. Vincent and the GrenadinesSub-Saharan Africa Sub-Saharan Africa (excluding high income)Sub-Saharan Africa (IDA & IBRD countries)SudanSurinameSwazilandSwedenSwitzerlandSyrian Arab RepublicTajikistanTanzaniaThailandTimor-LesteTogoTongaTrinidad and TobagoTunisiaTurkeyTurkmenistanTuvaluUgandaUkraineUnited Arab EmiratesUnited KingdomUnited StatesUpper middle incomeUruguayUzbekistanVanuatuVenezuela, RBVietnamWest Bank and GazaWorldYemen, Rep.ZambiaZimbabwe Timeline:
This timeline shows a graph from 1971 to 2015 of Trinidad and Tobago. No data until 1970. Number of actual observations by date: 45.
Source name:
World Development Indicators
Source organization:
World Bank staff estimates using data from the United Nations Statistics Division's National Accounts Statistics.
Categories, topics:
Economy & Growth, Environment
Last updated:
apr 23, 2017
Indicators value changes by year
Maximum:
14.261
jan 1, 2004
At the date of observation
Value
Absolute change
Change from previous value
jan 1, 1971
9.312
+9.312
0.0%
jan 1, 1972
9.793
+0.482
5.17%
jan 1, 1973
11.94
+2.147
21.92%
jan 1, 1974
8.75
-3.19
-26.72%
jan 1, 1975
7.64
-1.11
-12.68%
jan 1, 1976
5.949
-1.691
-22.14%
jan 1, 1977
8.163
+2.214
37.22%
jan 1, 1978
8.86
+0.697
8.54%
jan 1, 1979
7.086
-1.775
-20.03%
jan 1, 1980
6.3
-0.786
-11.09%
jan 1, 1981
5.581
-0.719
-11.42%
jan 1, 1982
5.674
+0.093
1.67%
jan 1, 1983
5.921
+0.247
4.35%
jan 1, 1984
7.52
+1.599
27.01%
jan 1, 1985
8.463
+0.943
12.54%
jan 1, 1986
8.741
+0.278
3.29%
jan 1, 1987
10.617
+1.875
21.45%
jan 1, 1988
11.111
+0.494
4.65%
jan 1, 1989
11.653
+0.542
4.88%
jan 1, 1990
11.698
+0.045
0.39%
jan 1, 1991
10.341
-1.357
-11.6%
jan 1, 1992
11.108
+0.767
7.42%
jan 1, 1993
11.815
+0.707
6.36%
jan 1, 1994
11.607
-0.208
-1.76%
jan 1, 1995
11.339
-0.268
-2.31%
jan 1, 1996
9.814
-1.525
-13.45%
jan 1, 1997
11.943
+2.129
21.69%
jan 1, 1998
11.602
-0.341
-2.85%
jan 1, 1999
12.003
+0.401
3.45%
jan 1, 2000
12.973
+0.97
8.08%
jan 1, 2001
12.006
-0.967
-7.45%
jan 1, 2002
12.336
+0.33
2.75%
jan 1, 2003
12.533
+0.197
1.6%
jan 1, 2004
14.261
+1.729
13.79%
jan 1, 2005
11.786
-2.475
-17.36%
jan 1, 2006
12.221
+0.435
3.69%
jan 1, 2007
13.299
+1.078
8.82%
jan 1, 2008
12.679
-0.62
-4.66%
jan 1, 2009
10.492
-2.187
-17.25%
jan 1, 2010
10.898
+0.406
3.87%
jan 1, 2011
10.648
-0.25
-2.3%
jan 1, 2012
11.533
+0.885
8.31%
jan 1, 2013
11.622
+0.09
0.78%
jan 1, 2014
11.552
-0.07
-0.61%
jan 1, 2015
10.13
-1.422
-12.31%
Ranking of countries by current statistics by years


Comments: