29
/
en
AIzaSyAYiBZKx7MnpbEhh9jyipgxe19OcubqV5w
April 1, 2024
180510
Liechtenstein
LIE
true
2
1
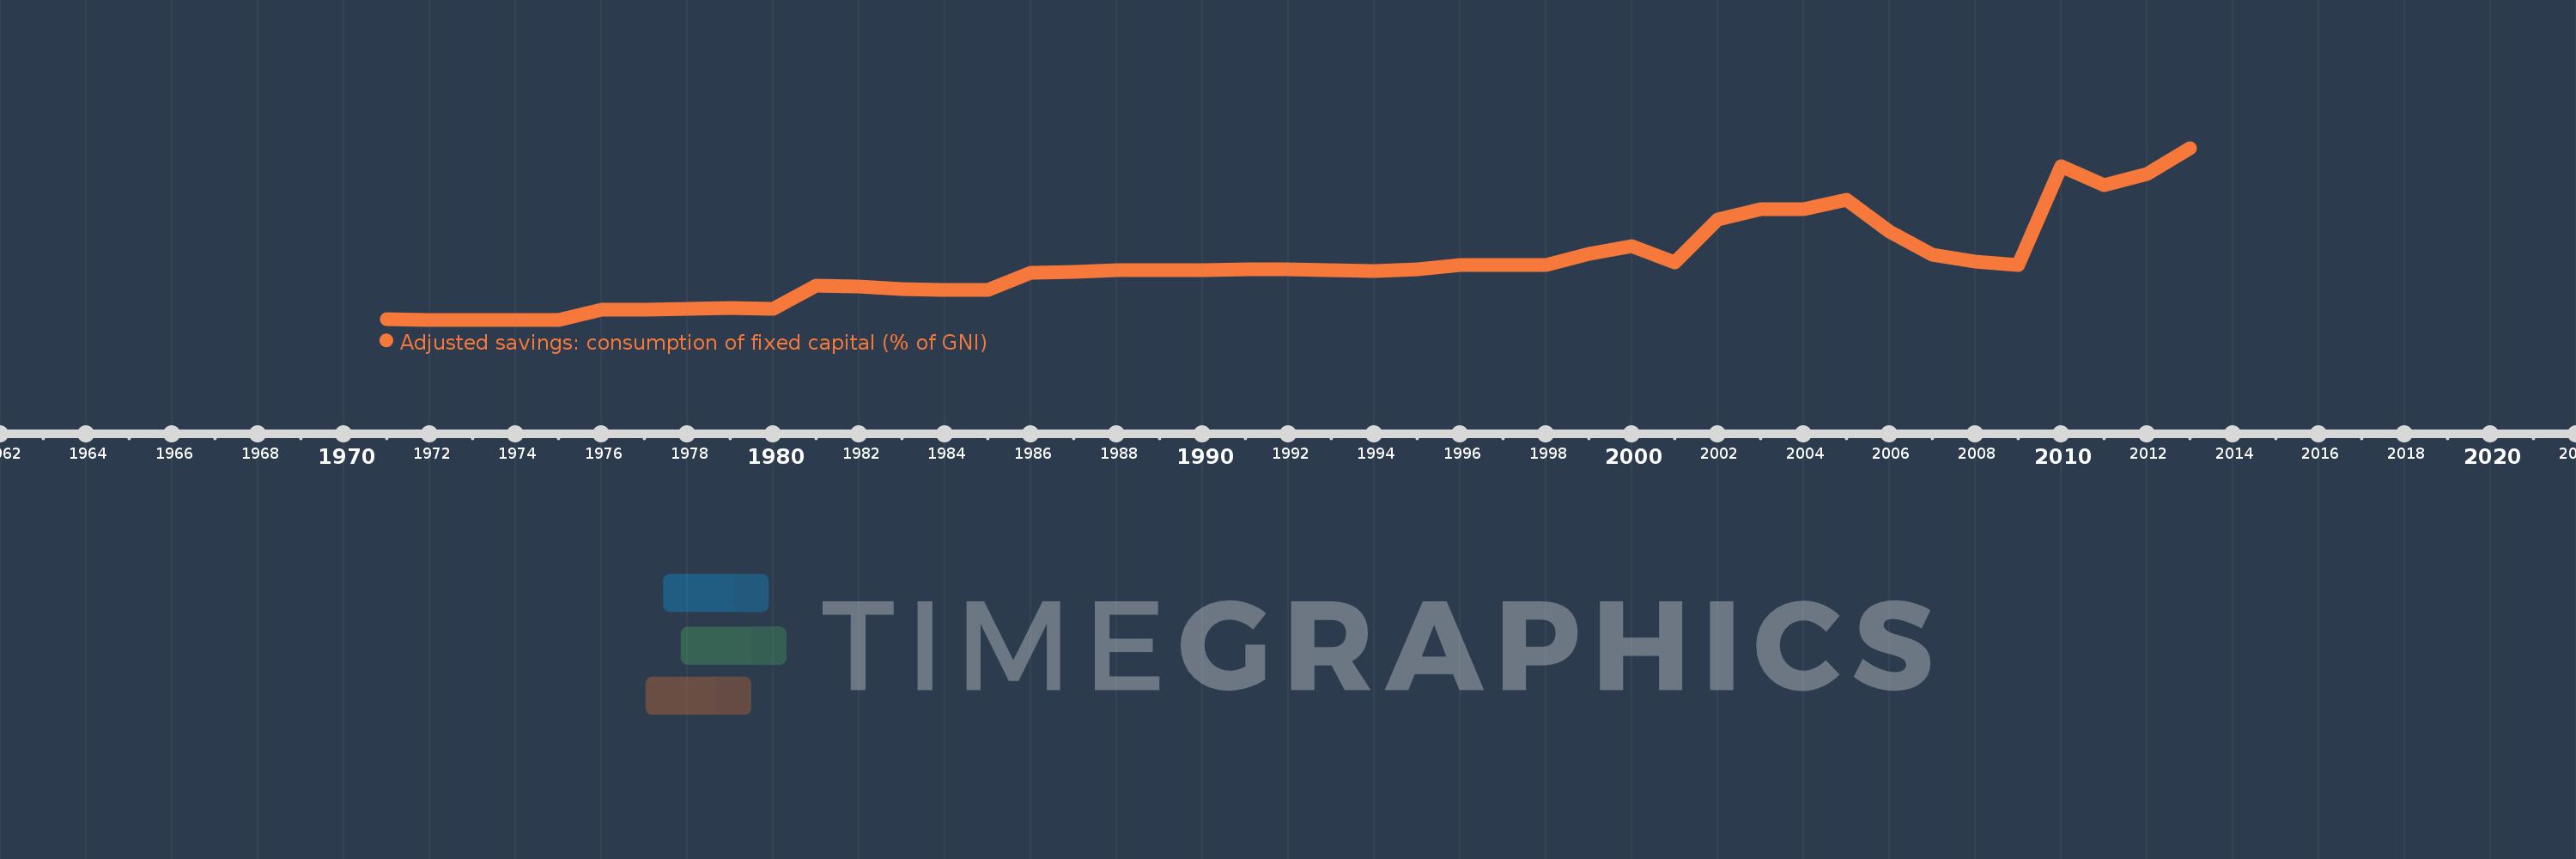
Adjusted savings: consumption of fixed capital (% of GNI)
2013,2012,2011,2010,2009,2008,2007,2006,2005,2004,2003,2002,2001,2000,1999,1998,1997,1996,1995,1994,1993,1992,1991,1990,1989,1988,1987,1986,1985,1984,1983,1982,1981,1980,1979,1978,1977,1976,1975,1974,1973,1972,1971
This statistics in other country:
AfghanistanAlbaniaAlgeriaAndorraAngolaAntigua and BarbudaArab WorldArgentinaArmeniaAustraliaAustriaAzerbaijanBahamas, TheBahrainBangladeshBarbadosBelarusBelgiumBelizeBeninBermudaBhutanBoliviaBosnia and HerzegovinaBotswanaBrazilBrunei DarussalamBulgariaBurkina FasoBurundiCabo VerdeCambodiaCameroonCanadaCaribbean small statesCentral African RepublicCentral Europe and the BalticsChadChileChinaColombiaComorosCongo, Dem. Rep.Congo, Rep.Costa RicaCote d'IvoireCroatiaCubaCyprusCzech RepublicDenmarkDjiboutiDominicaDominican RepublicEarly-demographic dividendEast Asia & PacificEast Asia & Pacific (excluding high income)East Asia & Pacific (IDA & IBRD countries)EcuadorEgypt, Arab Rep.El SalvadorEquatorial GuineaEritreaEstoniaEthiopiaEuro areaEurope & Central AsiaEurope & Central Asia (excluding high income)Europe & Central Asia (IDA & IBRD countries)European UnionFijiFinlandFragile and conflict affected situationsFranceGabonGambia, TheGeorgiaGermanyGhanaGreeceGreenlandGrenadaGuatemalaGuineaGuinea-BissauGuyanaHaitiHeavily indebted poor countries (HIPC)High incomeHondurasHong Kong SAR, ChinaHungaryIBRD onlyIcelandIDA & IBRD totalIDA blendIDA onlyIDA totalIndiaIndonesiaIran, Islamic Rep.IraqIrelandIsraelItalyJamaicaJapanJordanKazakhstanKenyaKiribatiKorea, Rep.KosovoKuwaitKyrgyz RepublicLao PDRLate-demographic dividendLatin America & Caribbean Latin America & Caribbean (excluding high income)Latin America & the Caribbean (IDA & IBRD countries)LatviaLeast developed countries: UN classificationLebanonLesothoLiberiaLibyaLiechtensteinLithuaniaLow & middle incomeLow incomeLower middle incomeLuxembourgMacao SAR, ChinaMacedonia, FYRMadagascarMalawiMalaysiaMaldivesMaliMaltaMarshall IslandsMauritaniaMauritiusMexicoMicronesia, Fed. Sts.Middle East & North AfricaMiddle East & North Africa (excluding high income)Middle East & North Africa (IDA & IBRD countries)Middle incomeMoldovaMonacoMongoliaMontenegroMoroccoMozambiqueMyanmarNamibiaNepalNetherlandsNew ZealandNicaraguaNigerNigeriaNorth AmericaNorwayOECD membersOmanOther small statesPacific island small statesPakistanPalauPanamaPapua New GuineaParaguayPeruPhilippinesPolandPortugalPost-demographic dividendPre-demographic dividendPuerto RicoQatarRomaniaRussian FederationRwandaSamoaSan MarinoSao Tome and PrincipeSaudi ArabiaSenegalSerbiaSeychellesSierra LeoneSingaporeSlovak RepublicSloveniaSmall statesSolomon IslandsSouth AfricaSouth AsiaSouth Asia (IDA & IBRD)SpainSri LankaSt. Kitts and NevisSt. LuciaSt. Vincent and the GrenadinesSub-Saharan Africa Sub-Saharan Africa (excluding high income)Sub-Saharan Africa (IDA & IBRD countries)SudanSurinameSwazilandSwedenSwitzerlandSyrian Arab RepublicTajikistanTanzaniaThailandTimor-LesteTogoTongaTrinidad and TobagoTunisiaTurkeyTurkmenistanTuvaluUgandaUkraineUnited Arab EmiratesUnited KingdomUnited StatesUpper middle incomeUruguayUzbekistanVanuatuVenezuela, RBVietnamWest Bank and GazaWorldYemen, Rep.ZambiaZimbabwe Timeline:
This timeline shows a graph from 1971 to 2013 of Liechtenstein. No data until 1970. Number of actual observations by date: 43.
Source name:
World Development Indicators
Source organization:
World Bank staff estimates using data from the United Nations Statistics Division's National Accounts Statistics.
Categories, topics:
Economy & Growth, Environment
Last updated:
apr 23, 2017
Indicators value changes by year
Maximum:
17.612
jan 1, 2013
At the date of observation
Value
Absolute change
Change from previous value
jan 1, 1971
8.276
+8.276
0.0%
jan 1, 1972
8.272
-0.004
-0.05%
jan 1, 1973
8.269
-0.002
-0.03%
jan 1, 1974
8.266
-0.003
-0.04%
jan 1, 1975
8.266
+0.001
0.01%
jan 1, 1976
8.808
+0.542
6.55%
jan 1, 1977
8.826
+0.018
0.2%
jan 1, 1978
8.866
+0.041
0.46%
jan 1, 1979
8.886
+0.019
0.22%
jan 1, 1980
8.88
-0.006
-0.07%
jan 1, 1981
10.104
+1.224
13.79%
jan 1, 1982
10.07
-0.034
-0.33%
jan 1, 1983
9.926
-0.144
-1.43%
jan 1, 1984
9.88
-0.046
-0.47%
jan 1, 1985
9.875
-0.005
-0.05%
jan 1, 1986
10.826
+0.951
9.63%
jan 1, 1987
10.865
+0.039
0.36%
jan 1, 1988
10.946
+0.081
0.75%
jan 1, 1989
10.955
+0.009
0.08%
jan 1, 1990
10.981
+0.026
0.24%
jan 1, 1991
11.018
+0.037
0.34%
jan 1, 1992
11.004
-0.014
-0.13%
jan 1, 1993
10.957
-0.047
-0.43%
jan 1, 1994
10.929
-0.028
-0.26%
jan 1, 1995
10.999
+0.071
0.65%
jan 1, 1996
11.247
+0.248
2.25%
jan 1, 1997
11.262
+0.015
0.13%
jan 1, 1998
11.228
-0.035
-0.31%
jan 1, 1999
11.863
+0.635
5.66%
jan 1, 2000
12.291
+0.428
3.61%
jan 1, 2001
11.391
-0.9
-7.32%
jan 1, 2002
13.733
+2.342
20.56%
jan 1, 2003
14.303
+0.57
4.15%
jan 1, 2004
14.287
-0.016
-0.11%
jan 1, 2005
14.789
+0.501
3.51%
jan 1, 2006
13.071
-1.718
-11.61%
jan 1, 2007
11.808
-1.263
-9.66%
jan 1, 2008
11.435
-0.373
-3.16%
jan 1, 2009
11.224
-0.211
-1.85%
jan 1, 2010
16.6
+5.377
47.9%
jan 1, 2011
15.569
-1.031
-6.21%
jan 1, 2012
16.197
+0.629
4.04%
jan 1, 2013
17.612
+1.414
8.73%
Ranking of countries by current statistics by years


Comments: