29
/
en
AIzaSyAYiBZKx7MnpbEhh9jyipgxe19OcubqV5w
April 1, 2024
77800
Bangladesh
BGD
true
2
1
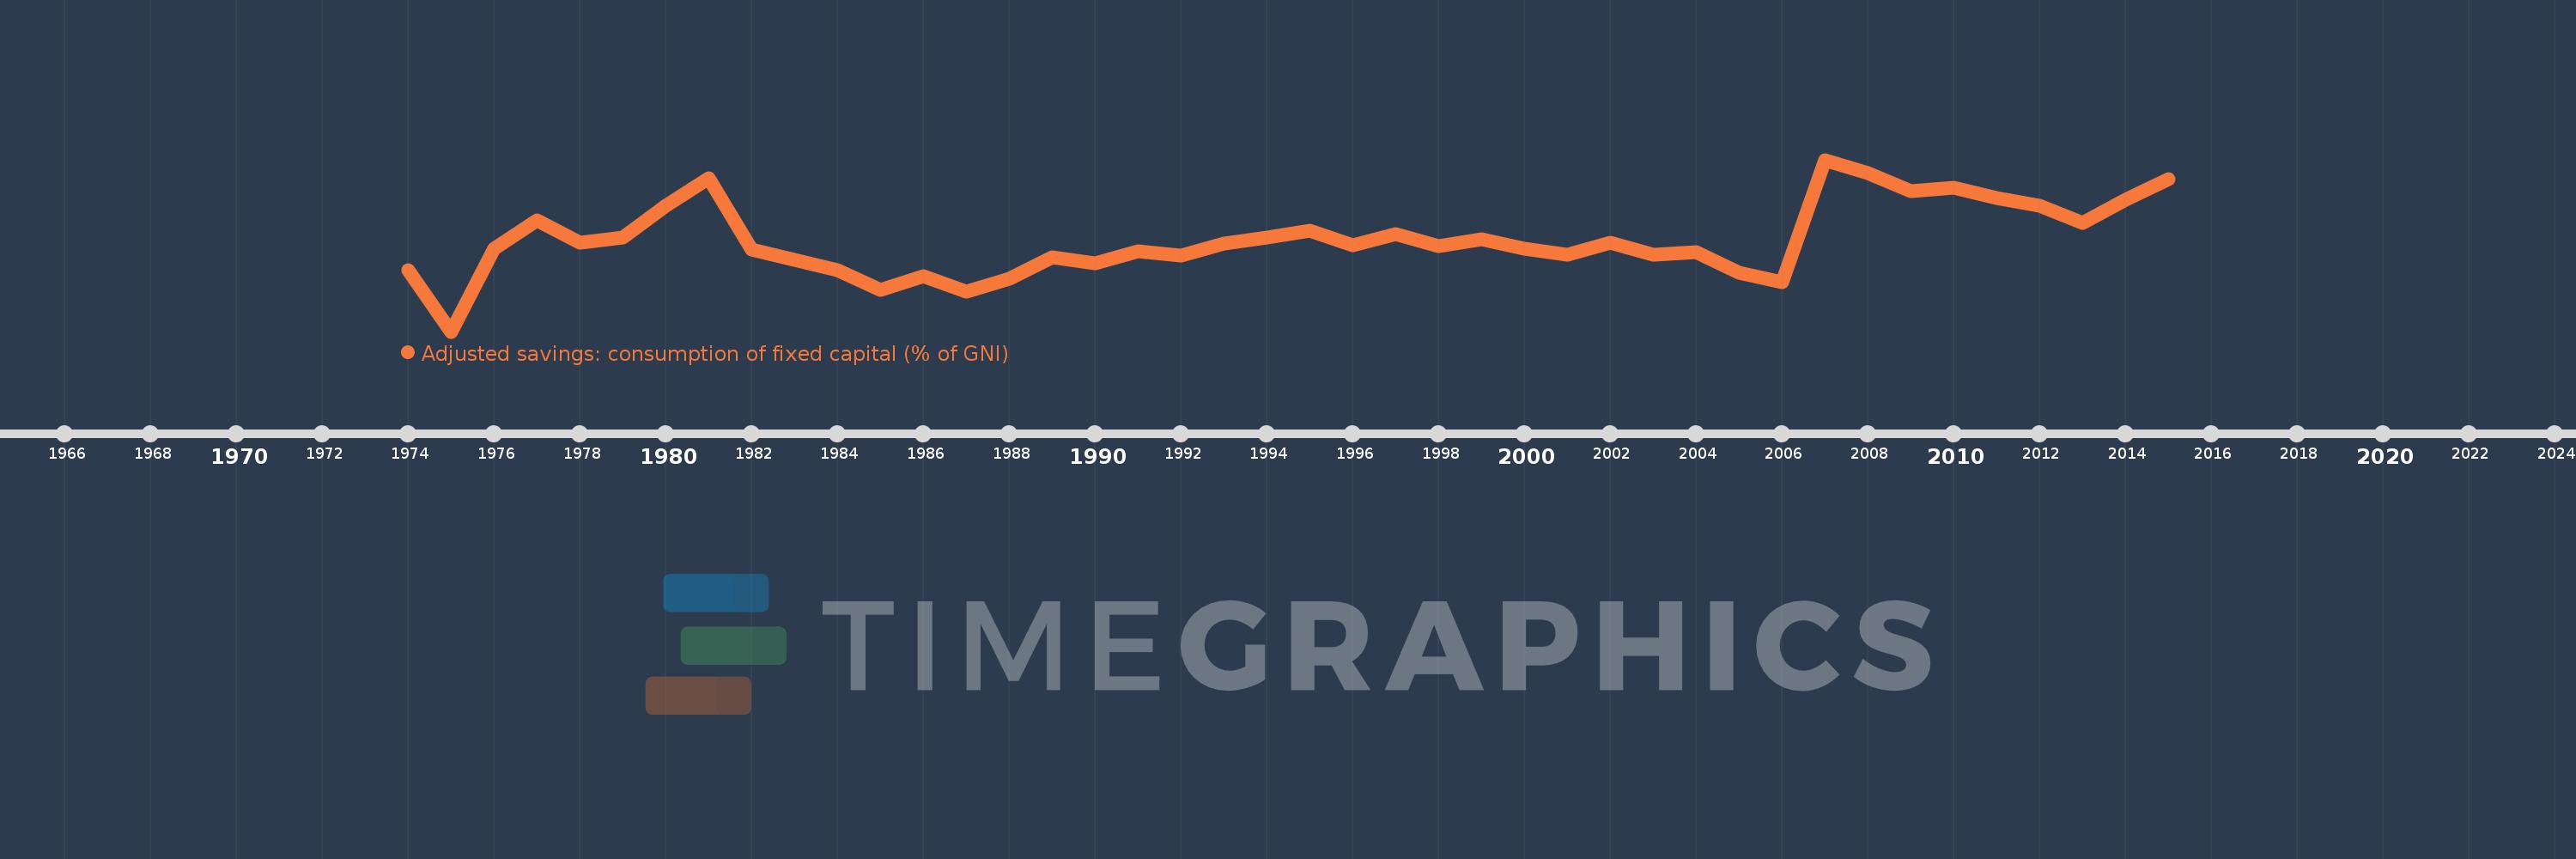
Adjusted savings: consumption of fixed capital (% of GNI)
2015,2014,2013,2012,2011,2010,2009,2008,2007,2006,2005,2004,2003,2002,2001,2000,1999,1998,1997,1996,1995,1994,1993,1992,1991,1990,1989,1988,1987,1986,1985,1984,1983,1982,1981,1980,1979,1978,1977,1976,1975,1974
This statistics in other country:
AfghanistanAlbaniaAlgeriaAndorraAngolaAntigua and BarbudaArab WorldArgentinaArmeniaAustraliaAustriaAzerbaijanBahamas, TheBahrainBangladeshBarbadosBelarusBelgiumBelizeBeninBermudaBhutanBoliviaBosnia and HerzegovinaBotswanaBrazilBrunei DarussalamBulgariaBurkina FasoBurundiCabo VerdeCambodiaCameroonCanadaCaribbean small statesCentral African RepublicCentral Europe and the BalticsChadChileChinaColombiaComorosCongo, Dem. Rep.Congo, Rep.Costa RicaCote d'IvoireCroatiaCubaCyprusCzech RepublicDenmarkDjiboutiDominicaDominican RepublicEarly-demographic dividendEast Asia & PacificEast Asia & Pacific (excluding high income)East Asia & Pacific (IDA & IBRD countries)EcuadorEgypt, Arab Rep.El SalvadorEquatorial GuineaEritreaEstoniaEthiopiaEuro areaEurope & Central AsiaEurope & Central Asia (excluding high income)Europe & Central Asia (IDA & IBRD countries)European UnionFijiFinlandFragile and conflict affected situationsFranceGabonGambia, TheGeorgiaGermanyGhanaGreeceGreenlandGrenadaGuatemalaGuineaGuinea-BissauGuyanaHaitiHeavily indebted poor countries (HIPC)High incomeHondurasHong Kong SAR, ChinaHungaryIBRD onlyIcelandIDA & IBRD totalIDA blendIDA onlyIDA totalIndiaIndonesiaIran, Islamic Rep.IraqIrelandIsraelItalyJamaicaJapanJordanKazakhstanKenyaKiribatiKorea, Rep.KosovoKuwaitKyrgyz RepublicLao PDRLate-demographic dividendLatin America & Caribbean Latin America & Caribbean (excluding high income)Latin America & the Caribbean (IDA & IBRD countries)LatviaLeast developed countries: UN classificationLebanonLesothoLiberiaLibyaLiechtensteinLithuaniaLow & middle incomeLow incomeLower middle incomeLuxembourgMacao SAR, ChinaMacedonia, FYRMadagascarMalawiMalaysiaMaldivesMaliMaltaMarshall IslandsMauritaniaMauritiusMexicoMicronesia, Fed. Sts.Middle East & North AfricaMiddle East & North Africa (excluding high income)Middle East & North Africa (IDA & IBRD countries)Middle incomeMoldovaMonacoMongoliaMontenegroMoroccoMozambiqueMyanmarNamibiaNepalNetherlandsNew ZealandNicaraguaNigerNigeriaNorth AmericaNorwayOECD membersOmanOther small statesPacific island small statesPakistanPalauPanamaPapua New GuineaParaguayPeruPhilippinesPolandPortugalPost-demographic dividendPre-demographic dividendPuerto RicoQatarRomaniaRussian FederationRwandaSamoaSan MarinoSao Tome and PrincipeSaudi ArabiaSenegalSerbiaSeychellesSierra LeoneSingaporeSlovak RepublicSloveniaSmall statesSolomon IslandsSouth AfricaSouth AsiaSouth Asia (IDA & IBRD)SpainSri LankaSt. Kitts and NevisSt. LuciaSt. Vincent and the GrenadinesSub-Saharan Africa Sub-Saharan Africa (excluding high income)Sub-Saharan Africa (IDA & IBRD countries)SudanSurinameSwazilandSwedenSwitzerlandSyrian Arab RepublicTajikistanTanzaniaThailandTimor-LesteTogoTongaTrinidad and TobagoTunisiaTurkeyTurkmenistanTuvaluUgandaUkraineUnited Arab EmiratesUnited KingdomUnited StatesUpper middle incomeUruguayUzbekistanVanuatuVenezuela, RBVietnamWest Bank and GazaWorldYemen, Rep.ZambiaZimbabwe Timeline:
This timeline shows a graph from 1974 to 2015 of Bangladesh. No data until 1973. Number of actual observations by date: 42.
Source name:
World Development Indicators
Source organization:
World Bank staff estimates using data from the United Nations Statistics Division's National Accounts Statistics.
Categories, topics:
Economy & Growth, Environment
Last updated:
apr 23, 2017
Indicators value changes by year
At the date of observation
Value
Absolute change
Change from previous value
jan 1, 1974
7.584
+7.584
0.0%
jan 1, 1975
7.206
-0.378
-4.99%
jan 1, 1976
7.721
+0.516
7.15%
jan 1, 1977
7.896
+0.175
2.26%
jan 1, 1978
7.755
-0.141
-1.79%
jan 1, 1979
7.789
+0.034
0.44%
jan 1, 1980
7.986
+0.197
2.53%
jan 1, 1981
8.156
+0.17
2.12%
jan 1, 1982
7.711
-0.445
-5.46%
jan 1, 1983
7.648
-0.063
-0.81%
jan 1, 1984
7.584
-0.064
-0.84%
jan 1, 1985
7.464
-0.119
-1.57%
jan 1, 1986
7.548
+0.083
1.12%
jan 1, 1987
7.455
-0.093
-1.23%
jan 1, 1988
7.532
+0.077
1.03%
jan 1, 1989
7.667
+0.136
1.8%
jan 1, 1990
7.628
-0.04
-0.52%
jan 1, 1991
7.702
+0.074
0.97%
jan 1, 1992
7.678
-0.023
-0.3%
jan 1, 1993
7.752
+0.074
0.96%
jan 1, 1994
7.788
+0.036
0.46%
jan 1, 1995
7.829
+0.041
0.53%
jan 1, 1996
7.738
-0.091
-1.17%
jan 1, 1997
7.808
+0.071
0.91%
jan 1, 1998
7.736
-0.072
-0.92%
jan 1, 1999
7.777
+0.041
0.53%
jan 1, 2000
7.718
-0.059
-0.76%
jan 1, 2001
7.683
-0.035
-0.45%
jan 1, 2002
7.757
+0.074
0.96%
jan 1, 2003
7.679
-0.078
-1.0%
jan 1, 2004
7.696
+0.017
0.23%
jan 1, 2005
7.57
-0.126
-1.64%
jan 1, 2006
7.511
-0.06
-0.79%
jan 1, 2007
8.268
+0.757
10.08%
jan 1, 2008
8.184
-0.084
-1.02%
jan 1, 2009
8.075
-0.109
-1.33%
jan 1, 2010
8.096
+0.021
0.26%
jan 1, 2011
8.033
-0.062
-0.77%
jan 1, 2012
7.982
-0.052
-0.65%
jan 1, 2013
7.88
-0.101
-1.27%
jan 1, 2014
8.021
+0.141
1.79%
jan 1, 2015
8.151
+0.13
1.62%
Ranking of countries by current statistics by years


Comments: