29
/
en
AIzaSyAYiBZKx7MnpbEhh9jyipgxe19OcubqV5w
April 1, 2024
39677
IDA total
IDA
false
2
1
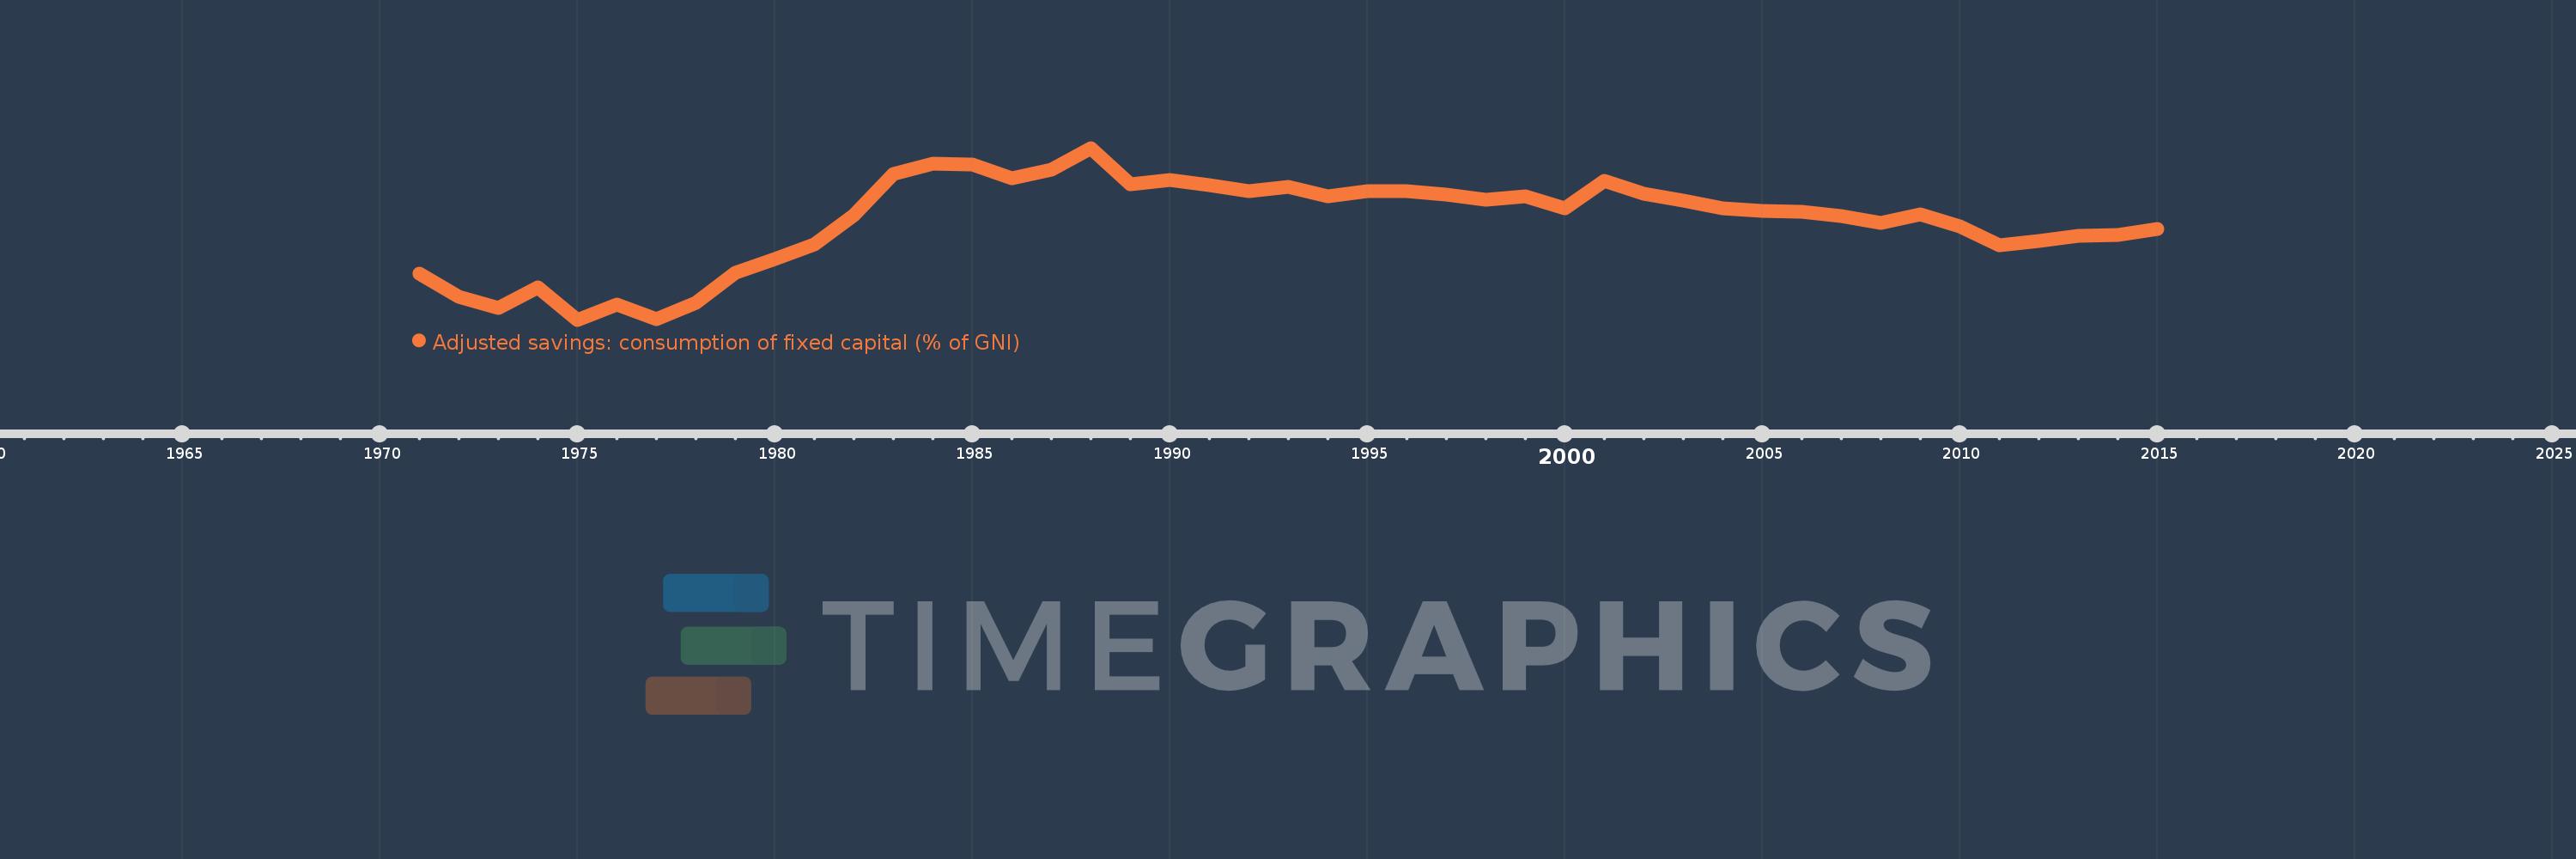
Adjusted savings: consumption of fixed capital (% of GNI)
2015,2014,2013,2012,2011,2010,2009,2008,2007,2006,2005,2004,2003,2002,2001,2000,1999,1998,1997,1996,1995,1994,1993,1992,1991,1990,1989,1988,1987,1986,1985,1984,1983,1982,1981,1980,1979,1978,1977,1976,1975,1974,1973,1972,1971
This statistics in other country:
AfghanistanAlbaniaAlgeriaAndorraAngolaAntigua and BarbudaArab WorldArgentinaArmeniaAustraliaAustriaAzerbaijanBahamas, TheBahrainBangladeshBarbadosBelarusBelgiumBelizeBeninBermudaBhutanBoliviaBosnia and HerzegovinaBotswanaBrazilBrunei DarussalamBulgariaBurkina FasoBurundiCabo VerdeCambodiaCameroonCanadaCaribbean small statesCentral African RepublicCentral Europe and the BalticsChadChileChinaColombiaComorosCongo, Dem. Rep.Congo, Rep.Costa RicaCote d'IvoireCroatiaCubaCyprusCzech RepublicDenmarkDjiboutiDominicaDominican RepublicEarly-demographic dividendEast Asia & PacificEast Asia & Pacific (excluding high income)East Asia & Pacific (IDA & IBRD countries)EcuadorEgypt, Arab Rep.El SalvadorEquatorial GuineaEritreaEstoniaEthiopiaEuro areaEurope & Central AsiaEurope & Central Asia (excluding high income)Europe & Central Asia (IDA & IBRD countries)European UnionFijiFinlandFragile and conflict affected situationsFranceGabonGambia, TheGeorgiaGermanyGhanaGreeceGreenlandGrenadaGuatemalaGuineaGuinea-BissauGuyanaHaitiHeavily indebted poor countries (HIPC)High incomeHondurasHong Kong SAR, ChinaHungaryIBRD onlyIcelandIDA & IBRD totalIDA blendIDA onlyIDA totalIndiaIndonesiaIran, Islamic Rep.IraqIrelandIsraelItalyJamaicaJapanJordanKazakhstanKenyaKiribatiKorea, Rep.KosovoKuwaitKyrgyz RepublicLao PDRLate-demographic dividendLatin America & Caribbean Latin America & Caribbean (excluding high income)Latin America & the Caribbean (IDA & IBRD countries)LatviaLeast developed countries: UN classificationLebanonLesothoLiberiaLibyaLiechtensteinLithuaniaLow & middle incomeLow incomeLower middle incomeLuxembourgMacao SAR, ChinaMacedonia, FYRMadagascarMalawiMalaysiaMaldivesMaliMaltaMarshall IslandsMauritaniaMauritiusMexicoMicronesia, Fed. Sts.Middle East & North AfricaMiddle East & North Africa (excluding high income)Middle East & North Africa (IDA & IBRD countries)Middle incomeMoldovaMonacoMongoliaMontenegroMoroccoMozambiqueMyanmarNamibiaNepalNetherlandsNew ZealandNicaraguaNigerNigeriaNorth AmericaNorwayOECD membersOmanOther small statesPacific island small statesPakistanPalauPanamaPapua New GuineaParaguayPeruPhilippinesPolandPortugalPost-demographic dividendPre-demographic dividendPuerto RicoQatarRomaniaRussian FederationRwandaSamoaSan MarinoSao Tome and PrincipeSaudi ArabiaSenegalSerbiaSeychellesSierra LeoneSingaporeSlovak RepublicSloveniaSmall statesSolomon IslandsSouth AfricaSouth AsiaSouth Asia (IDA & IBRD)SpainSri LankaSt. Kitts and NevisSt. LuciaSt. Vincent and the GrenadinesSub-Saharan Africa Sub-Saharan Africa (excluding high income)Sub-Saharan Africa (IDA & IBRD countries)SudanSurinameSwazilandSwedenSwitzerlandSyrian Arab RepublicTajikistanTanzaniaThailandTimor-LesteTogoTongaTrinidad and TobagoTunisiaTurkeyTurkmenistanTuvaluUgandaUkraineUnited Arab EmiratesUnited KingdomUnited StatesUpper middle incomeUruguayUzbekistanVanuatuVenezuela, RBVietnamWest Bank and GazaWorldYemen, Rep.ZambiaZimbabwe Timeline:
This timeline shows a graph from 1971 to 2015 of IDA total. No data until 1970. Number of actual observations by date: 45.
Source name:
World Development Indicators
Source organization:
World Bank staff estimates using data from the United Nations Statistics Division's National Accounts Statistics.
Categories, topics:
Economy & Growth, Environment
Last updated:
apr 23, 2017
Indicators value changes by year
At the date of observation
Value
Absolute change
Change from previous value
jan 1, 1971
6.227
+6.227
0.0%
jan 1, 1972
5.857
-0.37
-5.94%
jan 1, 1973
5.673
-0.183
-3.13%
jan 1, 1974
6.015
+0.342
6.02%
jan 1, 1975
5.486
-0.529
-8.79%
jan 1, 1976
5.727
+0.241
4.39%
jan 1, 1977
5.493
-0.234
-4.09%
jan 1, 1978
5.758
+0.265
4.82%
jan 1, 1979
6.252
+0.494
8.58%
jan 1, 1980
6.462
+0.21
3.36%
jan 1, 1981
6.698
+0.236
3.66%
jan 1, 1982
7.179
+0.481
7.18%
jan 1, 1983
7.845
+0.666
9.28%
jan 1, 1984
8.003
+0.158
2.01%
jan 1, 1985
7.997
-0.006
-0.08%
jan 1, 1986
7.778
-0.219
-2.74%
jan 1, 1987
7.909
+0.131
1.68%
jan 1, 1988
8.263
+0.354
4.47%
jan 1, 1989
7.669
-0.594
-7.19%
jan 1, 1990
7.742
+0.073
0.95%
jan 1, 1991
7.667
-0.075
-0.97%
jan 1, 1992
7.565
-0.102
-1.33%
jan 1, 1993
7.633
+0.068
0.91%
jan 1, 1994
7.475
-0.158
-2.07%
jan 1, 1995
7.564
+0.089
1.19%
jan 1, 1996
7.56
-0.004
-0.05%
jan 1, 1997
7.503
-0.057
-0.75%
jan 1, 1998
7.423
-0.08
-1.06%
jan 1, 1999
7.477
+0.054
0.72%
jan 1, 2000
7.29
-0.187
-2.5%
jan 1, 2001
7.73
+0.44
6.03%
jan 1, 2002
7.527
-0.202
-2.62%
jan 1, 2003
7.409
-0.118
-1.57%
jan 1, 2004
7.282
-0.127
-1.71%
jan 1, 2005
7.252
-0.03
-0.41%
jan 1, 2006
7.227
-0.026
-0.36%
jan 1, 2007
7.16
-0.066
-0.92%
jan 1, 2008
7.05
-0.111
-1.55%
jan 1, 2009
7.191
+0.142
2.01%
jan 1, 2010
6.994
-0.197
-2.74%
jan 1, 2011
6.695
-0.299
-4.27%
jan 1, 2012
6.76
+0.064
0.96%
jan 1, 2013
6.844
+0.085
1.25%
jan 1, 2014
6.851
+0.007
0.1%
jan 1, 2015
6.96
+0.109
1.58%
Ranking of countries by current statistics by years


Comments: