29
/
en
AIzaSyAYiBZKx7MnpbEhh9jyipgxe19OcubqV5w
April 1, 2024
139941
Ghana
GHA
true
2
1
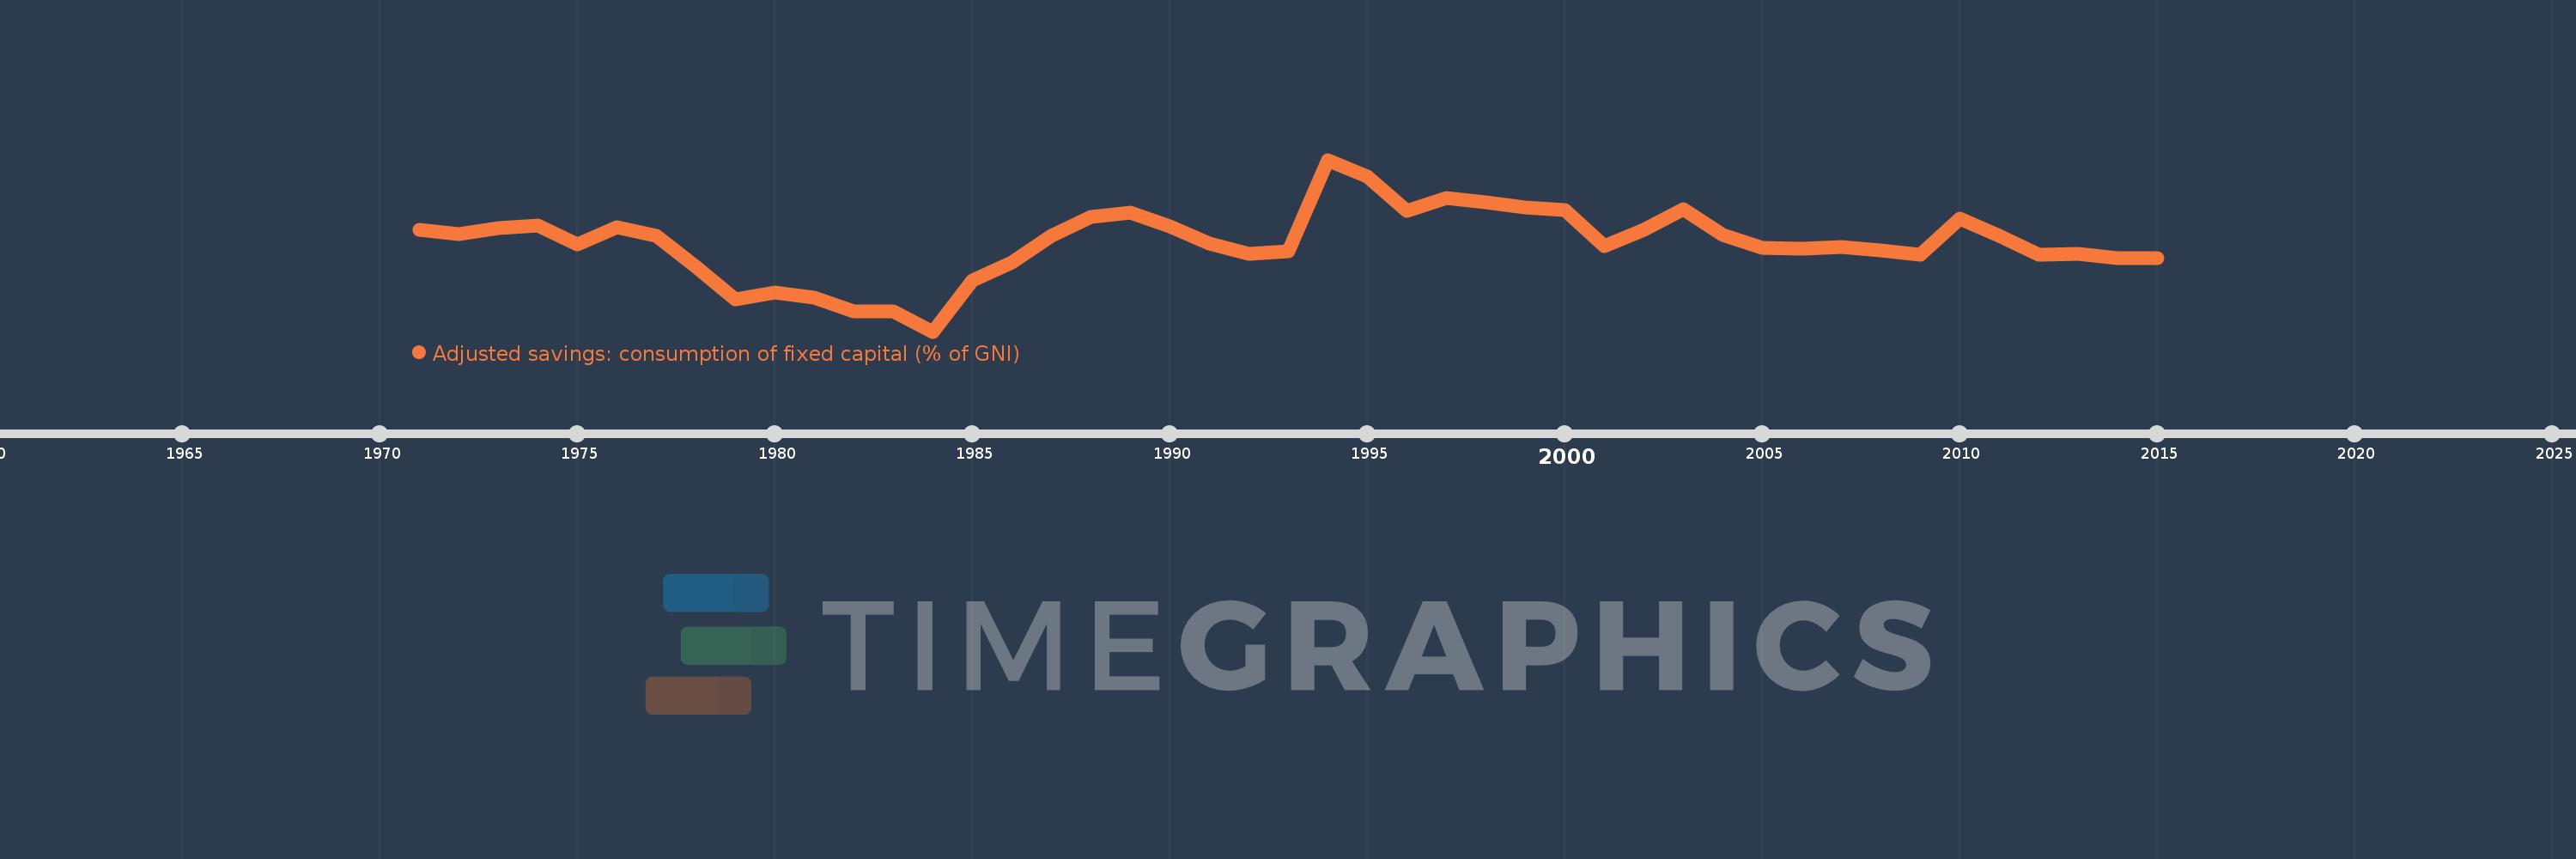
Adjusted savings: consumption of fixed capital (% of GNI)
2015,2014,2013,2012,2011,2010,2009,2008,2007,2006,2005,2004,2003,2002,2001,2000,1999,1998,1997,1996,1995,1994,1993,1992,1991,1990,1989,1988,1987,1986,1985,1984,1983,1982,1981,1980,1979,1978,1977,1976,1975,1974,1973,1972,1971
This statistics in other country:
AfghanistanAlbaniaAlgeriaAndorraAngolaAntigua and BarbudaArab WorldArgentinaArmeniaAustraliaAustriaAzerbaijanBahamas, TheBahrainBangladeshBarbadosBelarusBelgiumBelizeBeninBermudaBhutanBoliviaBosnia and HerzegovinaBotswanaBrazilBrunei DarussalamBulgariaBurkina FasoBurundiCabo VerdeCambodiaCameroonCanadaCaribbean small statesCentral African RepublicCentral Europe and the BalticsChadChileChinaColombiaComorosCongo, Dem. Rep.Congo, Rep.Costa RicaCote d'IvoireCroatiaCubaCyprusCzech RepublicDenmarkDjiboutiDominicaDominican RepublicEarly-demographic dividendEast Asia & PacificEast Asia & Pacific (excluding high income)East Asia & Pacific (IDA & IBRD countries)EcuadorEgypt, Arab Rep.El SalvadorEquatorial GuineaEritreaEstoniaEthiopiaEuro areaEurope & Central AsiaEurope & Central Asia (excluding high income)Europe & Central Asia (IDA & IBRD countries)European UnionFijiFinlandFragile and conflict affected situationsFranceGabonGambia, TheGeorgiaGermanyGhanaGreeceGreenlandGrenadaGuatemalaGuineaGuinea-BissauGuyanaHaitiHeavily indebted poor countries (HIPC)High incomeHondurasHong Kong SAR, ChinaHungaryIBRD onlyIcelandIDA & IBRD totalIDA blendIDA onlyIDA totalIndiaIndonesiaIran, Islamic Rep.IraqIrelandIsraelItalyJamaicaJapanJordanKazakhstanKenyaKiribatiKorea, Rep.KosovoKuwaitKyrgyz RepublicLao PDRLate-demographic dividendLatin America & Caribbean Latin America & Caribbean (excluding high income)Latin America & the Caribbean (IDA & IBRD countries)LatviaLeast developed countries: UN classificationLebanonLesothoLiberiaLibyaLiechtensteinLithuaniaLow & middle incomeLow incomeLower middle incomeLuxembourgMacao SAR, ChinaMacedonia, FYRMadagascarMalawiMalaysiaMaldivesMaliMaltaMarshall IslandsMauritaniaMauritiusMexicoMicronesia, Fed. Sts.Middle East & North AfricaMiddle East & North Africa (excluding high income)Middle East & North Africa (IDA & IBRD countries)Middle incomeMoldovaMonacoMongoliaMontenegroMoroccoMozambiqueMyanmarNamibiaNepalNetherlandsNew ZealandNicaraguaNigerNigeriaNorth AmericaNorwayOECD membersOmanOther small statesPacific island small statesPakistanPalauPanamaPapua New GuineaParaguayPeruPhilippinesPolandPortugalPost-demographic dividendPre-demographic dividendPuerto RicoQatarRomaniaRussian FederationRwandaSamoaSan MarinoSao Tome and PrincipeSaudi ArabiaSenegalSerbiaSeychellesSierra LeoneSingaporeSlovak RepublicSloveniaSmall statesSolomon IslandsSouth AfricaSouth AsiaSouth Asia (IDA & IBRD)SpainSri LankaSt. Kitts and NevisSt. LuciaSt. Vincent and the GrenadinesSub-Saharan Africa Sub-Saharan Africa (excluding high income)Sub-Saharan Africa (IDA & IBRD countries)SudanSurinameSwazilandSwedenSwitzerlandSyrian Arab RepublicTajikistanTanzaniaThailandTimor-LesteTogoTongaTrinidad and TobagoTunisiaTurkeyTurkmenistanTuvaluUgandaUkraineUnited Arab EmiratesUnited KingdomUnited StatesUpper middle incomeUruguayUzbekistanVanuatuVenezuela, RBVietnamWest Bank and GazaWorldYemen, Rep.ZambiaZimbabwe Timeline:
This timeline shows a graph from 1971 to 2015 of Ghana. No data until 1970. Number of actual observations by date: 45.
Source name:
World Development Indicators
Source organization:
World Bank staff estimates using data from the United Nations Statistics Division's National Accounts Statistics.
Categories, topics:
Economy & Growth, Environment
Last updated:
apr 23, 2017
Indicators value changes by year
At the date of observation
Value
Absolute change
Change from previous value
jan 1, 1971
6.067
+6.067
0.0%
jan 1, 1972
5.916
-0.151
-2.49%
jan 1, 1973
6.142
+0.226
3.82%
jan 1, 1974
6.227
+0.085
1.39%
jan 1, 1975
5.532
-0.695
-11.15%
jan 1, 1976
6.161
+0.629
11.36%
jan 1, 1977
5.838
-0.323
-5.24%
jan 1, 1978
4.716
-1.122
-19.22%
jan 1, 1979
3.496
-1.221
-25.88%
jan 1, 1980
3.741
+0.245
7.02%
jan 1, 1981
3.543
-0.198
-5.3%
jan 1, 1982
3.063
-0.479
-13.53%
jan 1, 1983
3.048
-0.015
-0.49%
jan 1, 1984
2.301
-0.747
-24.5%
jan 1, 1985
4.18
+1.879
81.63%
jan 1, 1986
4.849
+0.669
16.0%
jan 1, 1987
5.857
+1.008
20.78%
jan 1, 1988
6.559
+0.703
12.0%
jan 1, 1989
6.722
+0.163
2.48%
jan 1, 1990
6.203
-0.519
-7.73%
jan 1, 1991
5.574
-0.628
-10.13%
jan 1, 1992
5.193
-0.381
-6.84%
jan 1, 1993
5.27
+0.077
1.48%
jan 1, 1994
8.664
+3.394
64.41%
jan 1, 1995
8.053
-0.612
-7.06%
jan 1, 1996
6.772
-1.281
-15.91%
jan 1, 1997
7.238
+0.467
6.89%
jan 1, 1998
7.074
-0.164
-2.27%
jan 1, 1999
6.901
-0.173
-2.44%
jan 1, 2000
6.811
-0.091
-1.32%
jan 1, 2001
5.476
-1.335
-19.6%
jan 1, 2002
6.061
+0.586
10.7%
jan 1, 2003
6.843
+0.781
12.89%
jan 1, 2004
5.878
-0.965
-14.1%
jan 1, 2005
5.413
-0.465
-7.91%
jan 1, 2006
5.387
-0.027
-0.49%
jan 1, 2007
5.428
+0.042
0.77%
jan 1, 2008
5.307
-0.121
-2.23%
jan 1, 2009
5.163
-0.145
-2.73%
jan 1, 2010
6.469
+1.307
25.31%
jan 1, 2011
5.854
-0.616
-9.52%
jan 1, 2012
5.136
-0.717
-12.26%
jan 1, 2013
5.185
+0.049
0.95%
jan 1, 2014
5.008
-0.177
-3.41%
jan 1, 2015
5.035
+0.027
0.55%
Ranking of countries by current statistics by years


Comments: