29
/
en
AIzaSyAYiBZKx7MnpbEhh9jyipgxe19OcubqV5w
April 1, 2024
103228
Chad
TCD
true
2
1
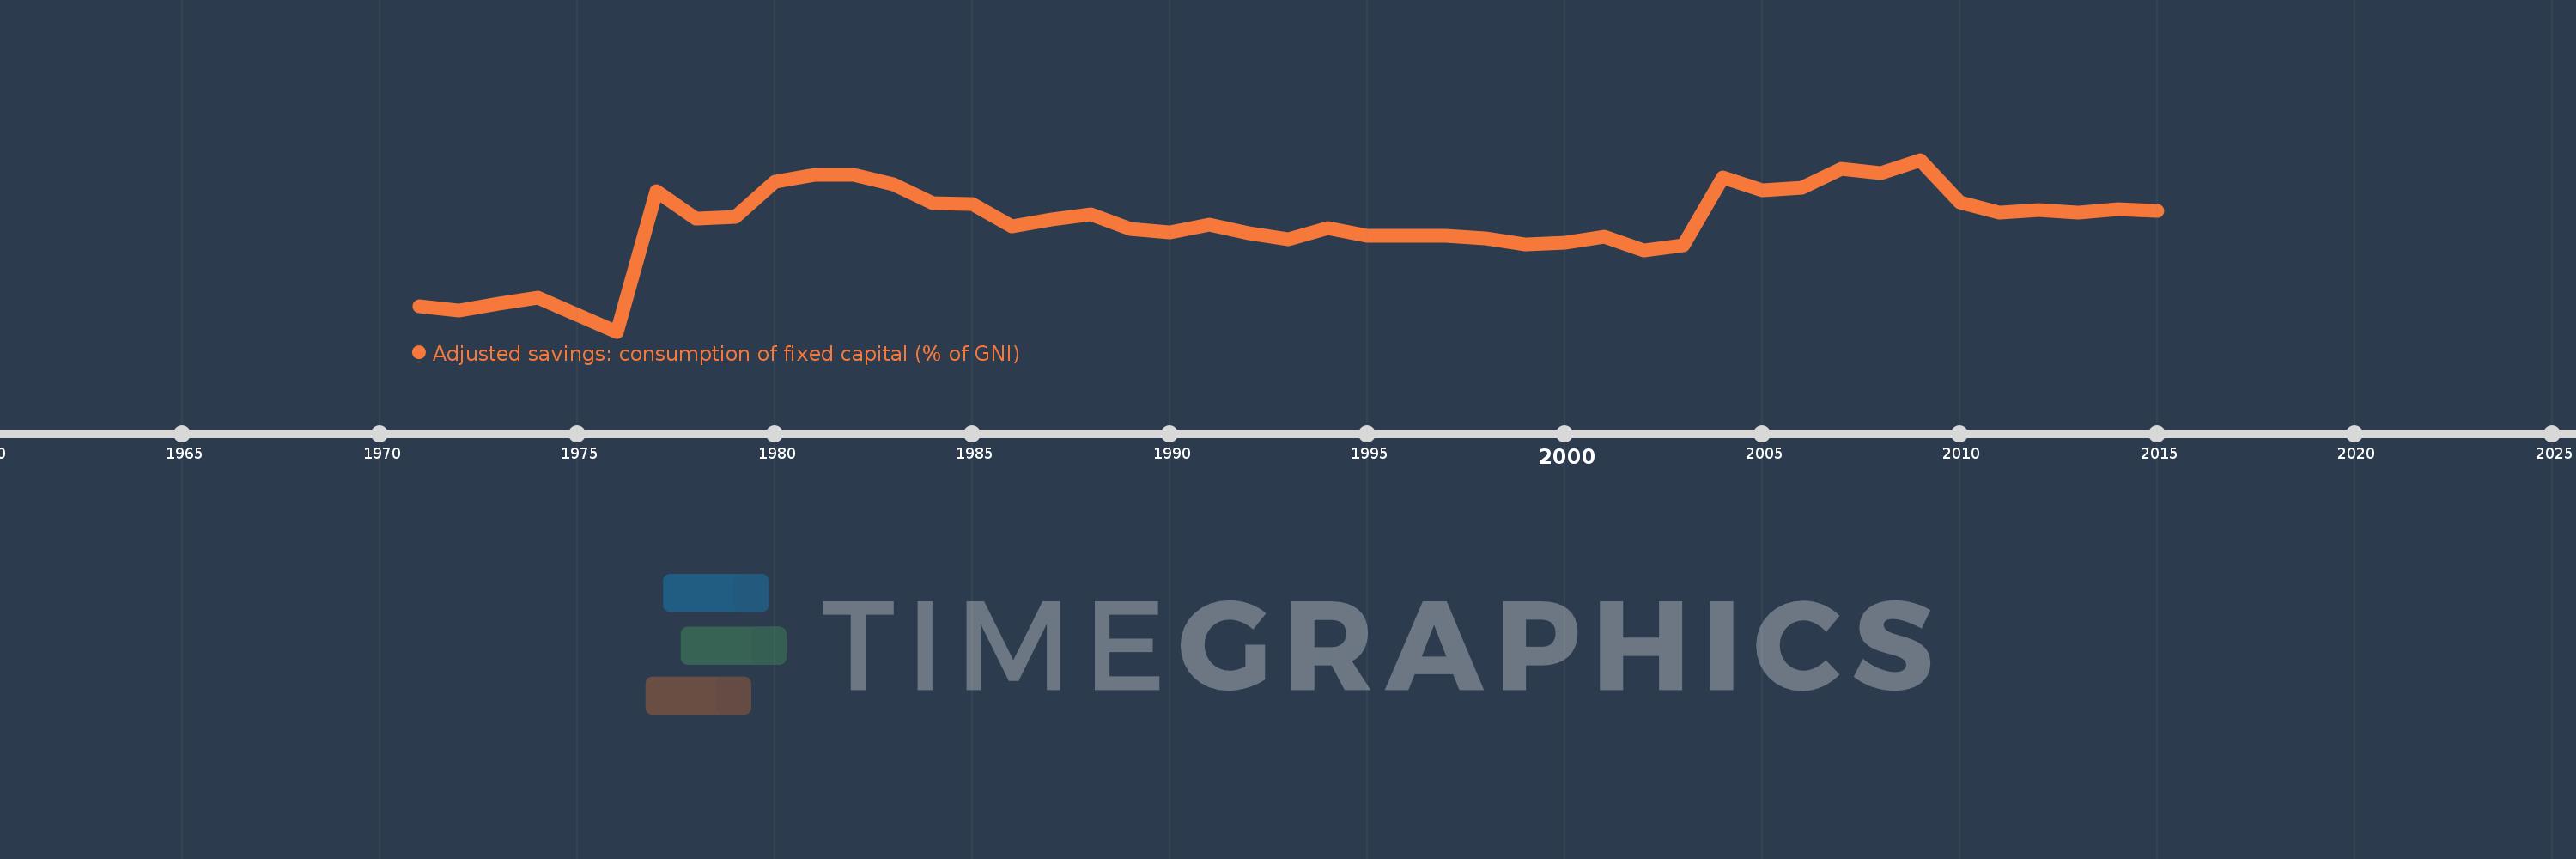
Adjusted savings: consumption of fixed capital (% of GNI)
2015,2014,2013,2012,2011,2010,2009,2008,2007,2006,2005,2004,2003,2002,2001,2000,1999,1998,1997,1996,1995,1994,1993,1992,1991,1990,1989,1988,1987,1986,1985,1984,1983,1982,1981,1980,1979,1978,1977,1976,1975,1974,1973,1972,1971
This statistics in other country:
AfghanistanAlbaniaAlgeriaAndorraAngolaAntigua and BarbudaArab WorldArgentinaArmeniaAustraliaAustriaAzerbaijanBahamas, TheBahrainBangladeshBarbadosBelarusBelgiumBelizeBeninBermudaBhutanBoliviaBosnia and HerzegovinaBotswanaBrazilBrunei DarussalamBulgariaBurkina FasoBurundiCabo VerdeCambodiaCameroonCanadaCaribbean small statesCentral African RepublicCentral Europe and the BalticsChadChileChinaColombiaComorosCongo, Dem. Rep.Congo, Rep.Costa RicaCote d'IvoireCroatiaCubaCyprusCzech RepublicDenmarkDjiboutiDominicaDominican RepublicEarly-demographic dividendEast Asia & PacificEast Asia & Pacific (excluding high income)East Asia & Pacific (IDA & IBRD countries)EcuadorEgypt, Arab Rep.El SalvadorEquatorial GuineaEritreaEstoniaEthiopiaEuro areaEurope & Central AsiaEurope & Central Asia (excluding high income)Europe & Central Asia (IDA & IBRD countries)European UnionFijiFinlandFragile and conflict affected situationsFranceGabonGambia, TheGeorgiaGermanyGhanaGreeceGreenlandGrenadaGuatemalaGuineaGuinea-BissauGuyanaHaitiHeavily indebted poor countries (HIPC)High incomeHondurasHong Kong SAR, ChinaHungaryIBRD onlyIcelandIDA & IBRD totalIDA blendIDA onlyIDA totalIndiaIndonesiaIran, Islamic Rep.IraqIrelandIsraelItalyJamaicaJapanJordanKazakhstanKenyaKiribatiKorea, Rep.KosovoKuwaitKyrgyz RepublicLao PDRLate-demographic dividendLatin America & Caribbean Latin America & Caribbean (excluding high income)Latin America & the Caribbean (IDA & IBRD countries)LatviaLeast developed countries: UN classificationLebanonLesothoLiberiaLibyaLiechtensteinLithuaniaLow & middle incomeLow incomeLower middle incomeLuxembourgMacao SAR, ChinaMacedonia, FYRMadagascarMalawiMalaysiaMaldivesMaliMaltaMarshall IslandsMauritaniaMauritiusMexicoMicronesia, Fed. Sts.Middle East & North AfricaMiddle East & North Africa (excluding high income)Middle East & North Africa (IDA & IBRD countries)Middle incomeMoldovaMonacoMongoliaMontenegroMoroccoMozambiqueMyanmarNamibiaNepalNetherlandsNew ZealandNicaraguaNigerNigeriaNorth AmericaNorwayOECD membersOmanOther small statesPacific island small statesPakistanPalauPanamaPapua New GuineaParaguayPeruPhilippinesPolandPortugalPost-demographic dividendPre-demographic dividendPuerto RicoQatarRomaniaRussian FederationRwandaSamoaSan MarinoSao Tome and PrincipeSaudi ArabiaSenegalSerbiaSeychellesSierra LeoneSingaporeSlovak RepublicSloveniaSmall statesSolomon IslandsSouth AfricaSouth AsiaSouth Asia (IDA & IBRD)SpainSri LankaSt. Kitts and NevisSt. LuciaSt. Vincent and the GrenadinesSub-Saharan Africa Sub-Saharan Africa (excluding high income)Sub-Saharan Africa (IDA & IBRD countries)SudanSurinameSwazilandSwedenSwitzerlandSyrian Arab RepublicTajikistanTanzaniaThailandTimor-LesteTogoTongaTrinidad and TobagoTunisiaTurkeyTurkmenistanTuvaluUgandaUkraineUnited Arab EmiratesUnited KingdomUnited StatesUpper middle incomeUruguayUzbekistanVanuatuVenezuela, RBVietnamWest Bank and GazaWorldYemen, Rep.ZambiaZimbabwe Timeline:
This timeline shows a graph from 1971 to 2015 of Chad. No data until 1970. Number of actual observations by date: 45.
Source name:
World Development Indicators
Source organization:
World Bank staff estimates using data from the United Nations Statistics Division's National Accounts Statistics.
Categories, topics:
Economy & Growth, Environment
Last updated:
apr 23, 2017
Indicators value changes by year
At the date of observation
Value
Absolute change
Change from previous value
jan 1, 1971
4.185
+4.185
0.0%
jan 1, 1972
4.088
-0.097
-2.32%
jan 1, 1973
4.264
+0.176
4.31%
jan 1, 1974
4.403
+0.139
3.26%
jan 1, 1975
3.965
-0.439
-9.96%
jan 1, 1976
3.539
-0.425
-10.73%
jan 1, 1977
7.15
+3.611
102.03%
jan 1, 1978
6.44
-0.711
-9.94%
jan 1, 1979
6.495
+0.055
0.86%
jan 1, 1980
7.398
+0.903
13.9%
jan 1, 1981
7.572
+0.175
2.36%
jan 1, 1982
7.57
-0.003
-0.03%
jan 1, 1983
7.336
-0.233
-3.08%
jan 1, 1984
6.85
-0.486
-6.63%
jan 1, 1985
6.817
-0.033
-0.48%
jan 1, 1986
6.242
-0.575
-8.44%
jan 1, 1987
6.432
+0.191
3.05%
jan 1, 1988
6.554
+0.121
1.89%
jan 1, 1989
6.187
-0.367
-5.6%
jan 1, 1990
6.103
-0.084
-1.36%
jan 1, 1991
6.298
+0.196
3.21%
jan 1, 1992
6.075
-0.223
-3.54%
jan 1, 1993
5.918
-0.158
-2.59%
jan 1, 1994
6.21
+0.292
4.93%
jan 1, 1995
5.999
-0.211
-3.4%
jan 1, 1996
6.005
+0.007
0.11%
jan 1, 1997
6.005
+0.0
0.0%
jan 1, 1998
5.936
-0.069
-1.15%
jan 1, 1999
5.775
-0.161
-2.71%
jan 1, 2000
5.826
+0.051
0.88%
jan 1, 2001
5.974
+0.148
2.54%
jan 1, 2002
5.634
-0.339
-5.68%
jan 1, 2003
5.77
+0.135
2.4%
jan 1, 2004
7.501
+1.732
30.01%
jan 1, 2005
7.177
-0.325
-4.33%
jan 1, 2006
7.253
+0.076
1.06%
jan 1, 2007
7.723
+0.47
6.48%
jan 1, 2008
7.626
-0.097
-1.26%
jan 1, 2009
7.962
+0.337
4.42%
jan 1, 2010
6.863
-1.1
-13.81%
jan 1, 2011
6.594
-0.269
-3.91%
jan 1, 2012
6.676
+0.082
1.25%
jan 1, 2013
6.603
-0.074
-1.1%
jan 1, 2014
6.688
+0.085
1.29%
jan 1, 2015
6.652
-0.036
-0.54%
Ranking of countries by current statistics by years


Comments: