29
/
en
AIzaSyAYiBZKx7MnpbEhh9jyipgxe19OcubqV5w
April 1, 2024
161162
Italy
ITA
true
2
1
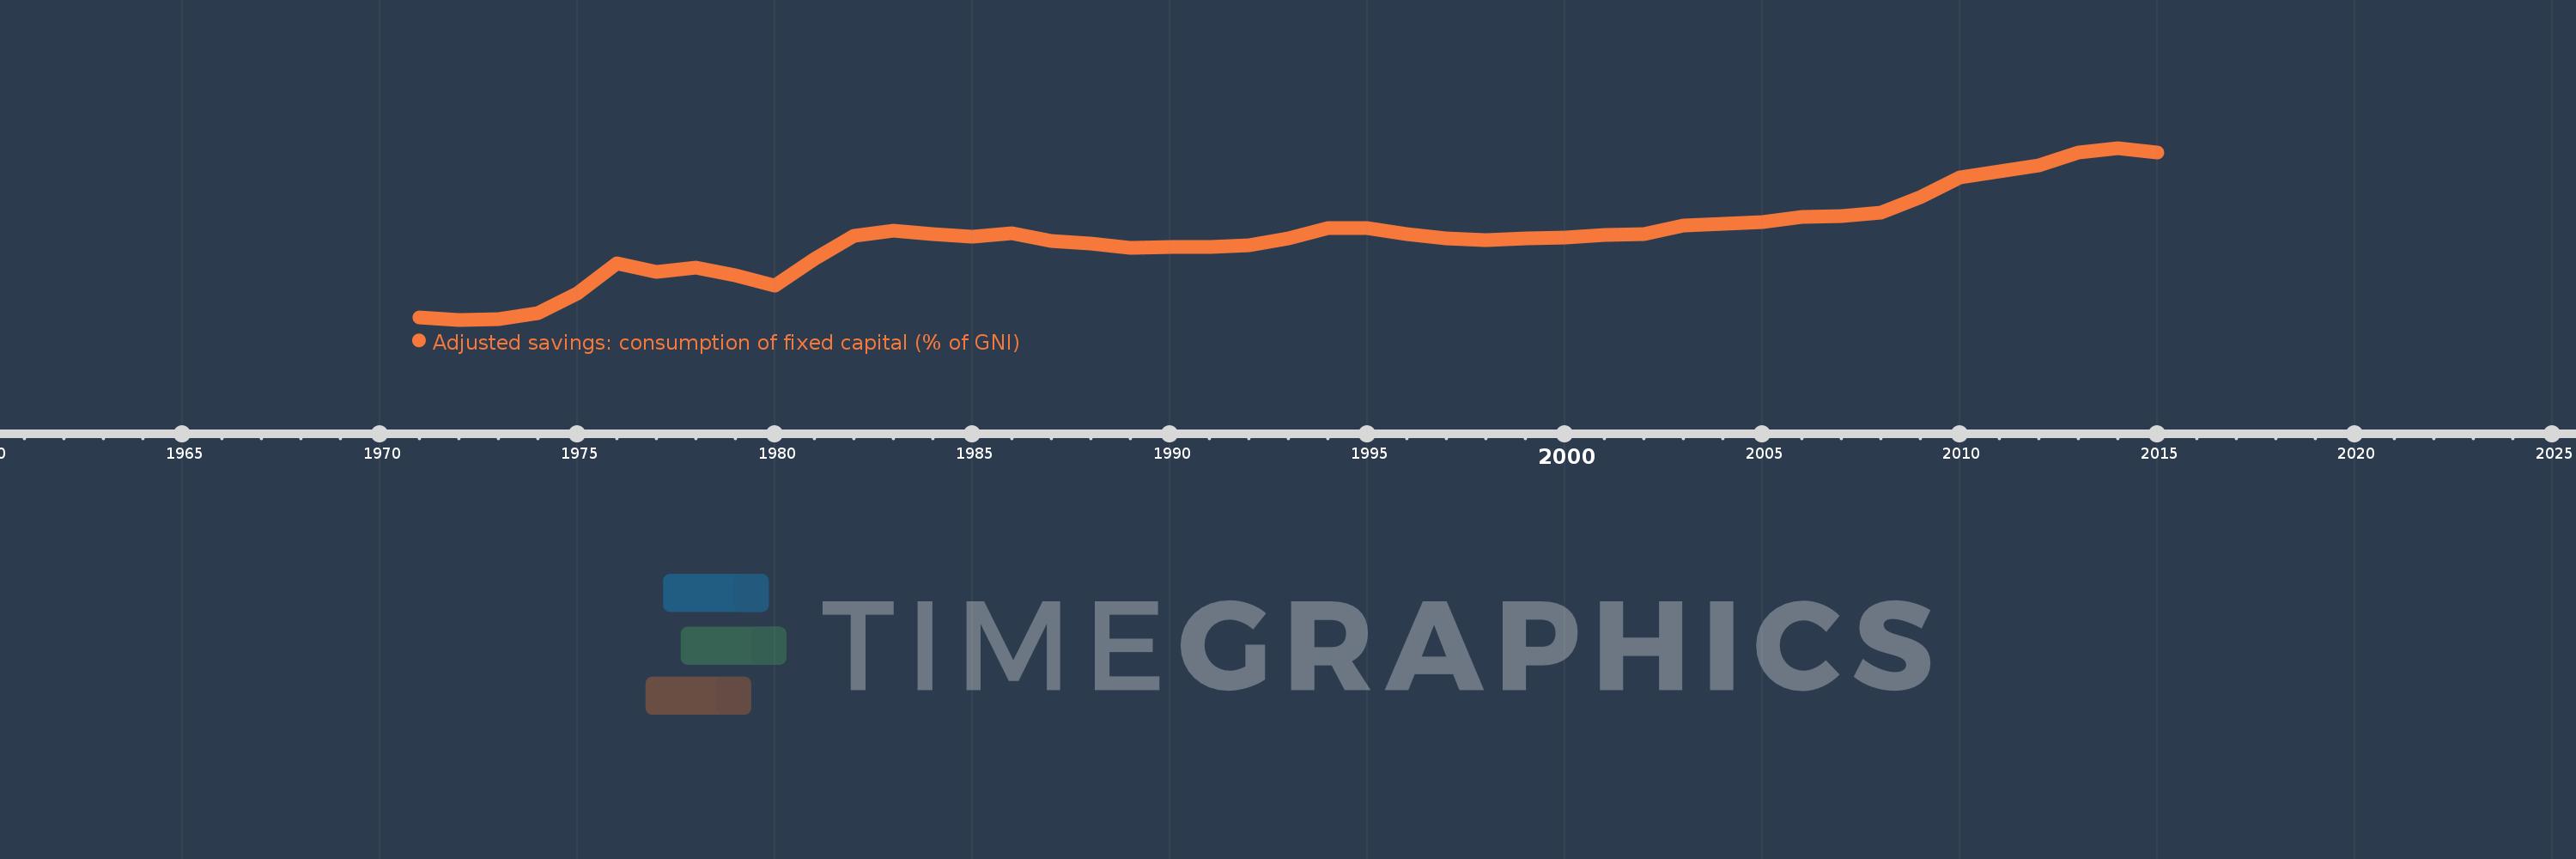
Adjusted savings: consumption of fixed capital (% of GNI)
2015,2014,2013,2012,2011,2010,2009,2008,2007,2006,2005,2004,2003,2002,2001,2000,1999,1998,1997,1996,1995,1994,1993,1992,1991,1990,1989,1988,1987,1986,1985,1984,1983,1982,1981,1980,1979,1978,1977,1976,1975,1974,1973,1972,1971
This statistics in other country:
AfghanistanAlbaniaAlgeriaAndorraAngolaAntigua and BarbudaArab WorldArgentinaArmeniaAustraliaAustriaAzerbaijanBahamas, TheBahrainBangladeshBarbadosBelarusBelgiumBelizeBeninBermudaBhutanBoliviaBosnia and HerzegovinaBotswanaBrazilBrunei DarussalamBulgariaBurkina FasoBurundiCabo VerdeCambodiaCameroonCanadaCaribbean small statesCentral African RepublicCentral Europe and the BalticsChadChileChinaColombiaComorosCongo, Dem. Rep.Congo, Rep.Costa RicaCote d'IvoireCroatiaCubaCyprusCzech RepublicDenmarkDjiboutiDominicaDominican RepublicEarly-demographic dividendEast Asia & PacificEast Asia & Pacific (excluding high income)East Asia & Pacific (IDA & IBRD countries)EcuadorEgypt, Arab Rep.El SalvadorEquatorial GuineaEritreaEstoniaEthiopiaEuro areaEurope & Central AsiaEurope & Central Asia (excluding high income)Europe & Central Asia (IDA & IBRD countries)European UnionFijiFinlandFragile and conflict affected situationsFranceGabonGambia, TheGeorgiaGermanyGhanaGreeceGreenlandGrenadaGuatemalaGuineaGuinea-BissauGuyanaHaitiHeavily indebted poor countries (HIPC)High incomeHondurasHong Kong SAR, ChinaHungaryIBRD onlyIcelandIDA & IBRD totalIDA blendIDA onlyIDA totalIndiaIndonesiaIran, Islamic Rep.IraqIrelandIsraelItalyJamaicaJapanJordanKazakhstanKenyaKiribatiKorea, Rep.KosovoKuwaitKyrgyz RepublicLao PDRLate-demographic dividendLatin America & Caribbean Latin America & Caribbean (excluding high income)Latin America & the Caribbean (IDA & IBRD countries)LatviaLeast developed countries: UN classificationLebanonLesothoLiberiaLibyaLiechtensteinLithuaniaLow & middle incomeLow incomeLower middle incomeLuxembourgMacao SAR, ChinaMacedonia, FYRMadagascarMalawiMalaysiaMaldivesMaliMaltaMarshall IslandsMauritaniaMauritiusMexicoMicronesia, Fed. Sts.Middle East & North AfricaMiddle East & North Africa (excluding high income)Middle East & North Africa (IDA & IBRD countries)Middle incomeMoldovaMonacoMongoliaMontenegroMoroccoMozambiqueMyanmarNamibiaNepalNetherlandsNew ZealandNicaraguaNigerNigeriaNorth AmericaNorwayOECD membersOmanOther small statesPacific island small statesPakistanPalauPanamaPapua New GuineaParaguayPeruPhilippinesPolandPortugalPost-demographic dividendPre-demographic dividendPuerto RicoQatarRomaniaRussian FederationRwandaSamoaSan MarinoSao Tome and PrincipeSaudi ArabiaSenegalSerbiaSeychellesSierra LeoneSingaporeSlovak RepublicSloveniaSmall statesSolomon IslandsSouth AfricaSouth AsiaSouth Asia (IDA & IBRD)SpainSri LankaSt. Kitts and NevisSt. LuciaSt. Vincent and the GrenadinesSub-Saharan Africa Sub-Saharan Africa (excluding high income)Sub-Saharan Africa (IDA & IBRD countries)SudanSurinameSwazilandSwedenSwitzerlandSyrian Arab RepublicTajikistanTanzaniaThailandTimor-LesteTogoTongaTrinidad and TobagoTunisiaTurkeyTurkmenistanTuvaluUgandaUkraineUnited Arab EmiratesUnited KingdomUnited StatesUpper middle incomeUruguayUzbekistanVanuatuVenezuela, RBVietnamWest Bank and GazaWorldYemen, Rep.ZambiaZimbabwe Timeline:
This timeline shows a graph from 1971 to 2015 of Italy. No data until 1970. Number of actual observations by date: 45.
Source name:
World Development Indicators
Source organization:
World Bank staff estimates using data from the United Nations Statistics Division's National Accounts Statistics.
Categories, topics:
Economy & Growth, Environment
Last updated:
apr 23, 2017
Indicators value changes by year
Minimum:
11.135
jan 1, 1972
Maximum:
18.487
jan 1, 2014
At the date of observation
Value
Absolute change
Change from previous value
jan 1, 1971
11.226
+11.226
0.0%
jan 1, 1972
11.135
-0.092
-0.82%
jan 1, 1973
11.171
+0.036
0.33%
jan 1, 1974
11.433
+0.262
2.34%
jan 1, 1975
12.253
+0.821
7.18%
jan 1, 1976
13.568
+1.314
10.73%
jan 1, 1977
13.191
-0.376
-2.77%
jan 1, 1978
13.349
+0.158
1.2%
jan 1, 1979
13.049
-0.3
-2.25%
jan 1, 1980
12.576
-0.474
-3.63%
jan 1, 1981
13.73
+1.154
9.18%
jan 1, 1982
14.71
+0.981
7.14%
jan 1, 1983
14.949
+0.239
1.62%
jan 1, 1984
14.802
-0.147
-0.99%
jan 1, 1985
14.698
-0.104
-0.7%
jan 1, 1986
14.844
+0.146
0.99%
jan 1, 1987
14.521
-0.323
-2.18%
jan 1, 1988
14.382
-0.139
-0.95%
jan 1, 1989
14.221
-0.161
-1.12%
jan 1, 1990
14.247
+0.026
0.18%
jan 1, 1991
14.241
-0.006
-0.04%
jan 1, 1992
14.319
+0.078
0.55%
jan 1, 1993
14.624
+0.305
2.13%
jan 1, 1994
15.051
+0.427
2.92%
jan 1, 1995
15.04
-0.011
-0.07%
jan 1, 1996
14.791
-0.249
-1.65%
jan 1, 1997
14.631
-0.161
-1.09%
jan 1, 1998
14.558
-0.073
-0.5%
jan 1, 1999
14.617
+0.059
0.41%
jan 1, 2000
14.66
+0.042
0.29%
jan 1, 2001
14.772
+0.112
0.77%
jan 1, 2002
14.818
+0.047
0.32%
jan 1, 2003
15.181
+0.363
2.45%
jan 1, 2004
15.235
+0.054
0.36%
jan 1, 2005
15.297
+0.062
0.41%
jan 1, 2006
15.524
+0.227
1.48%
jan 1, 2007
15.57
+0.045
0.29%
jan 1, 2008
15.73
+0.16
1.03%
jan 1, 2009
16.395
+0.666
4.23%
jan 1, 2010
17.209
+0.814
4.96%
jan 1, 2011
17.49
+0.281
1.63%
jan 1, 2012
17.736
+0.246
1.41%
jan 1, 2013
18.304
+0.568
3.2%
jan 1, 2014
18.487
+0.183
1.0%
jan 1, 2015
18.281
-0.205
-1.11%
Ranking of countries by current statistics by years


Comments: