29
/
en
AIzaSyAYiBZKx7MnpbEhh9jyipgxe19OcubqV5w
April 1, 2024
120624
Dominica
DMA
true
2
1
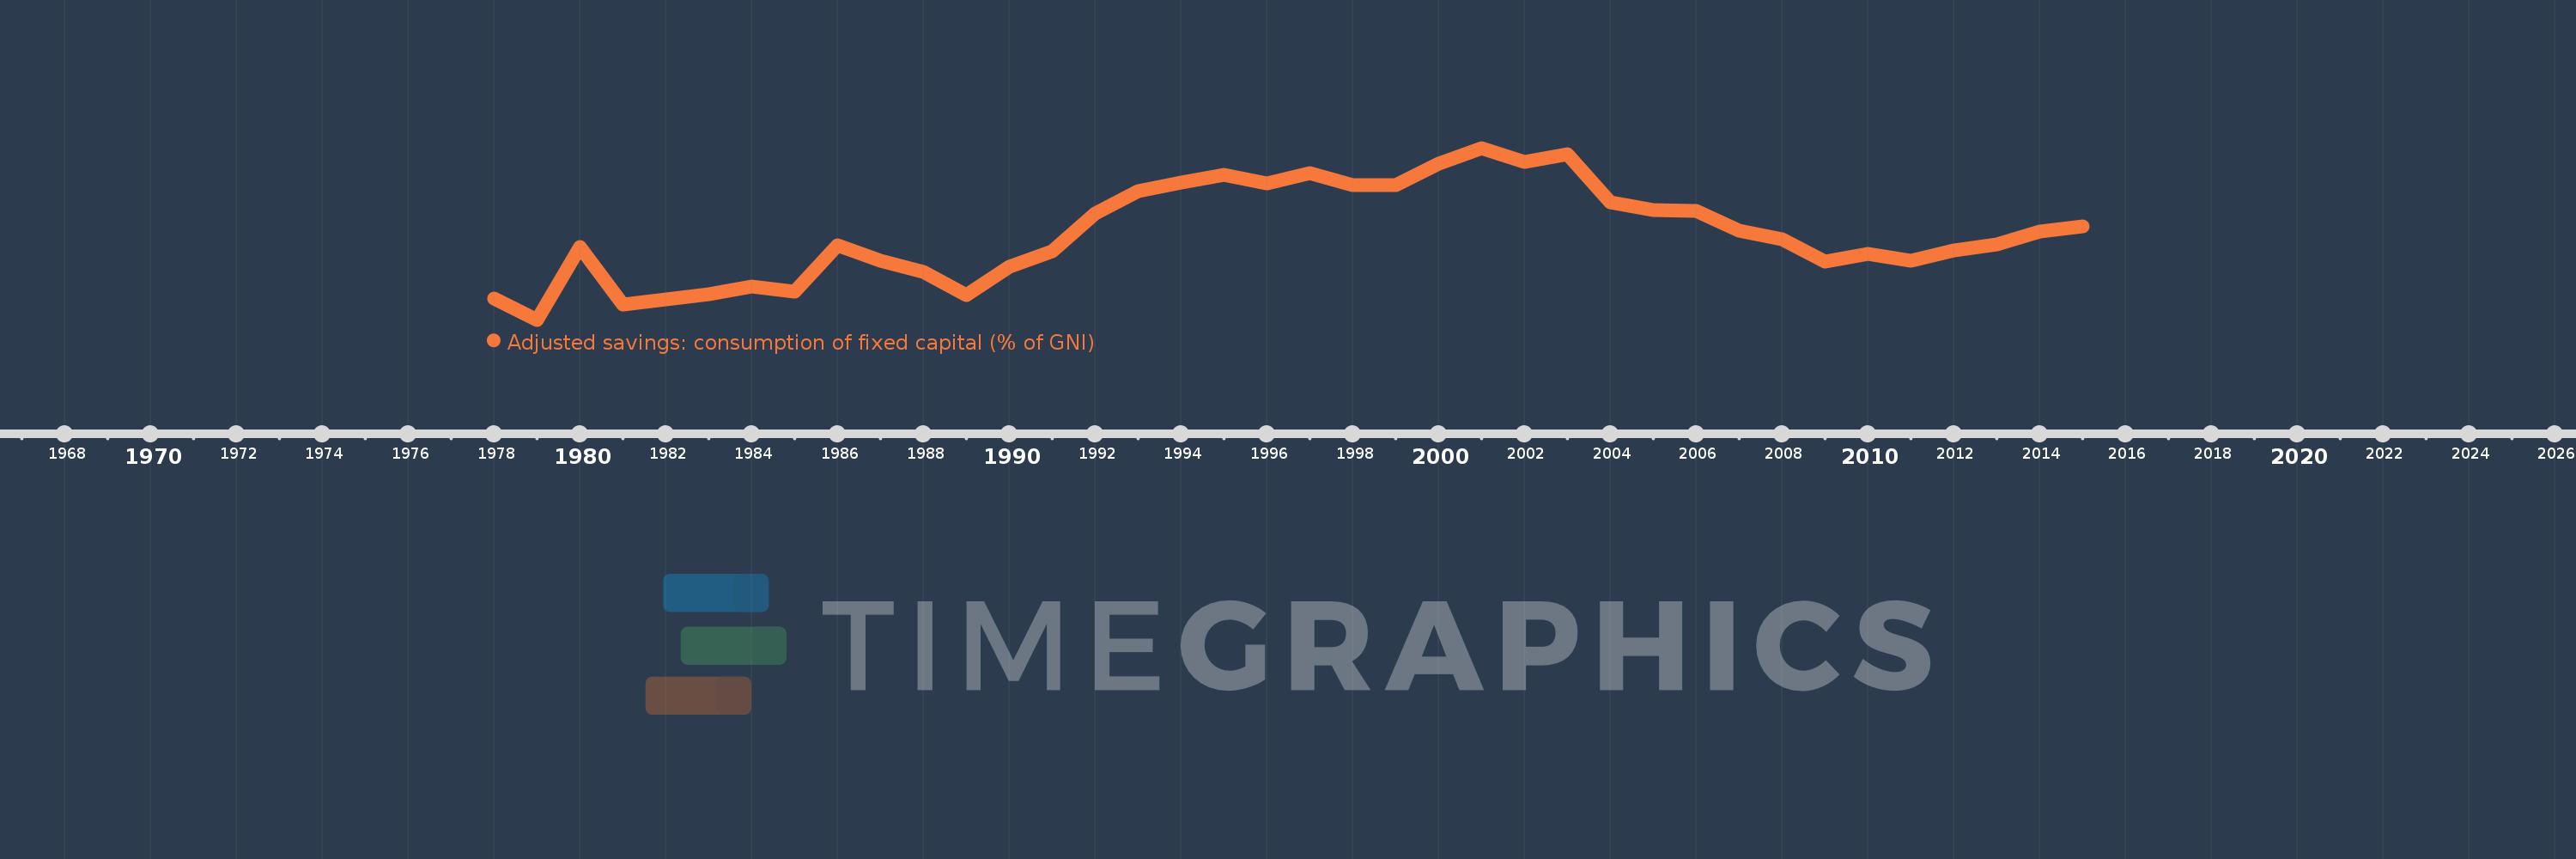
Adjusted savings: consumption of fixed capital (% of GNI)
2015,2014,2013,2012,2011,2010,2009,2008,2007,2006,2005,2004,2003,2002,2001,2000,1999,1998,1997,1996,1995,1994,1993,1992,1991,1990,1989,1988,1987,1986,1985,1984,1983,1982,1981,1980,1979,1978
This statistics in other country:
AfghanistanAlbaniaAlgeriaAndorraAngolaAntigua and BarbudaArab WorldArgentinaArmeniaAustraliaAustriaAzerbaijanBahamas, TheBahrainBangladeshBarbadosBelarusBelgiumBelizeBeninBermudaBhutanBoliviaBosnia and HerzegovinaBotswanaBrazilBrunei DarussalamBulgariaBurkina FasoBurundiCabo VerdeCambodiaCameroonCanadaCaribbean small statesCentral African RepublicCentral Europe and the BalticsChadChileChinaColombiaComorosCongo, Dem. Rep.Congo, Rep.Costa RicaCote d'IvoireCroatiaCubaCyprusCzech RepublicDenmarkDjiboutiDominicaDominican RepublicEarly-demographic dividendEast Asia & PacificEast Asia & Pacific (excluding high income)East Asia & Pacific (IDA & IBRD countries)EcuadorEgypt, Arab Rep.El SalvadorEquatorial GuineaEritreaEstoniaEthiopiaEuro areaEurope & Central AsiaEurope & Central Asia (excluding high income)Europe & Central Asia (IDA & IBRD countries)European UnionFijiFinlandFragile and conflict affected situationsFranceGabonGambia, TheGeorgiaGermanyGhanaGreeceGreenlandGrenadaGuatemalaGuineaGuinea-BissauGuyanaHaitiHeavily indebted poor countries (HIPC)High incomeHondurasHong Kong SAR, ChinaHungaryIBRD onlyIcelandIDA & IBRD totalIDA blendIDA onlyIDA totalIndiaIndonesiaIran, Islamic Rep.IraqIrelandIsraelItalyJamaicaJapanJordanKazakhstanKenyaKiribatiKorea, Rep.KosovoKuwaitKyrgyz RepublicLao PDRLate-demographic dividendLatin America & Caribbean Latin America & Caribbean (excluding high income)Latin America & the Caribbean (IDA & IBRD countries)LatviaLeast developed countries: UN classificationLebanonLesothoLiberiaLibyaLiechtensteinLithuaniaLow & middle incomeLow incomeLower middle incomeLuxembourgMacao SAR, ChinaMacedonia, FYRMadagascarMalawiMalaysiaMaldivesMaliMaltaMarshall IslandsMauritaniaMauritiusMexicoMicronesia, Fed. Sts.Middle East & North AfricaMiddle East & North Africa (excluding high income)Middle East & North Africa (IDA & IBRD countries)Middle incomeMoldovaMonacoMongoliaMontenegroMoroccoMozambiqueMyanmarNamibiaNepalNetherlandsNew ZealandNicaraguaNigerNigeriaNorth AmericaNorwayOECD membersOmanOther small statesPacific island small statesPakistanPalauPanamaPapua New GuineaParaguayPeruPhilippinesPolandPortugalPost-demographic dividendPre-demographic dividendPuerto RicoQatarRomaniaRussian FederationRwandaSamoaSan MarinoSao Tome and PrincipeSaudi ArabiaSenegalSerbiaSeychellesSierra LeoneSingaporeSlovak RepublicSloveniaSmall statesSolomon IslandsSouth AfricaSouth AsiaSouth Asia (IDA & IBRD)SpainSri LankaSt. Kitts and NevisSt. LuciaSt. Vincent and the GrenadinesSub-Saharan Africa Sub-Saharan Africa (excluding high income)Sub-Saharan Africa (IDA & IBRD countries)SudanSurinameSwazilandSwedenSwitzerlandSyrian Arab RepublicTajikistanTanzaniaThailandTimor-LesteTogoTongaTrinidad and TobagoTunisiaTurkeyTurkmenistanTuvaluUgandaUkraineUnited Arab EmiratesUnited KingdomUnited StatesUpper middle incomeUruguayUzbekistanVanuatuVenezuela, RBVietnamWest Bank and GazaWorldYemen, Rep.ZambiaZimbabwe Timeline:
This timeline shows a graph from 1978 to 2015 of Dominica. No data until 1977. Number of actual observations by date: 38.
Source name:
World Development Indicators
Source organization:
World Bank staff estimates using data from the United Nations Statistics Division's National Accounts Statistics.
Categories, topics:
Economy & Growth, Environment
Last updated:
apr 23, 2017
Indicators value changes by year
At the date of observation
Value
Absolute change
Change from previous value
jan 1, 1978
3.075
+3.075
0.0%
jan 1, 1979
2.89
-0.185
-6.02%
jan 1, 1980
3.526
+0.636
22.0%
jan 1, 1981
3.025
-0.501
-14.22%
jan 1, 1982
3.065
+0.04
1.33%
jan 1, 1983
3.114
+0.049
1.61%
jan 1, 1984
3.181
+0.067
2.15%
jan 1, 1985
3.133
-0.048
-1.51%
jan 1, 1986
3.54
+0.407
12.98%
jan 1, 1987
3.404
-0.136
-3.83%
jan 1, 1988
3.312
-0.092
-2.71%
jan 1, 1989
3.105
-0.207
-6.24%
jan 1, 1990
3.357
+0.252
8.12%
jan 1, 1991
3.491
+0.134
3.98%
jan 1, 1992
3.818
+0.327
9.37%
jan 1, 1993
4.02
+0.202
5.28%
jan 1, 1994
4.095
+0.075
1.86%
jan 1, 1995
4.156
+0.062
1.51%
jan 1, 1996
4.084
-0.072
-1.74%
jan 1, 1997
4.174
+0.09
2.21%
jan 1, 1998
4.069
-0.105
-2.52%
jan 1, 1999
4.067
-0.003
-0.06%
jan 1, 2000
4.256
+0.189
4.64%
jan 1, 2001
4.395
+0.139
3.27%
jan 1, 2002
4.273
-0.121
-2.76%
jan 1, 2003
4.338
+0.064
1.51%
jan 1, 2004
3.922
-0.416
-9.59%
jan 1, 2005
3.852
-0.07
-1.78%
jan 1, 2006
3.847
-0.005
-0.12%
jan 1, 2007
3.669
-0.178
-4.62%
jan 1, 2008
3.597
-0.072
-1.97%
jan 1, 2009
3.403
-0.194
-5.38%
jan 1, 2010
3.47
+0.066
1.94%
jan 1, 2011
3.406
-0.064
-1.84%
jan 1, 2012
3.494
+0.088
2.58%
jan 1, 2013
3.549
+0.055
1.58%
jan 1, 2014
3.663
+0.114
3.2%
jan 1, 2015
3.707
+0.044
1.21%
Ranking of countries by current statistics by years


Comments: