29
/
en
AIzaSyAYiBZKx7MnpbEhh9jyipgxe19OcubqV5w
April 1, 2024
247235
Spain
ESP
true
2
1
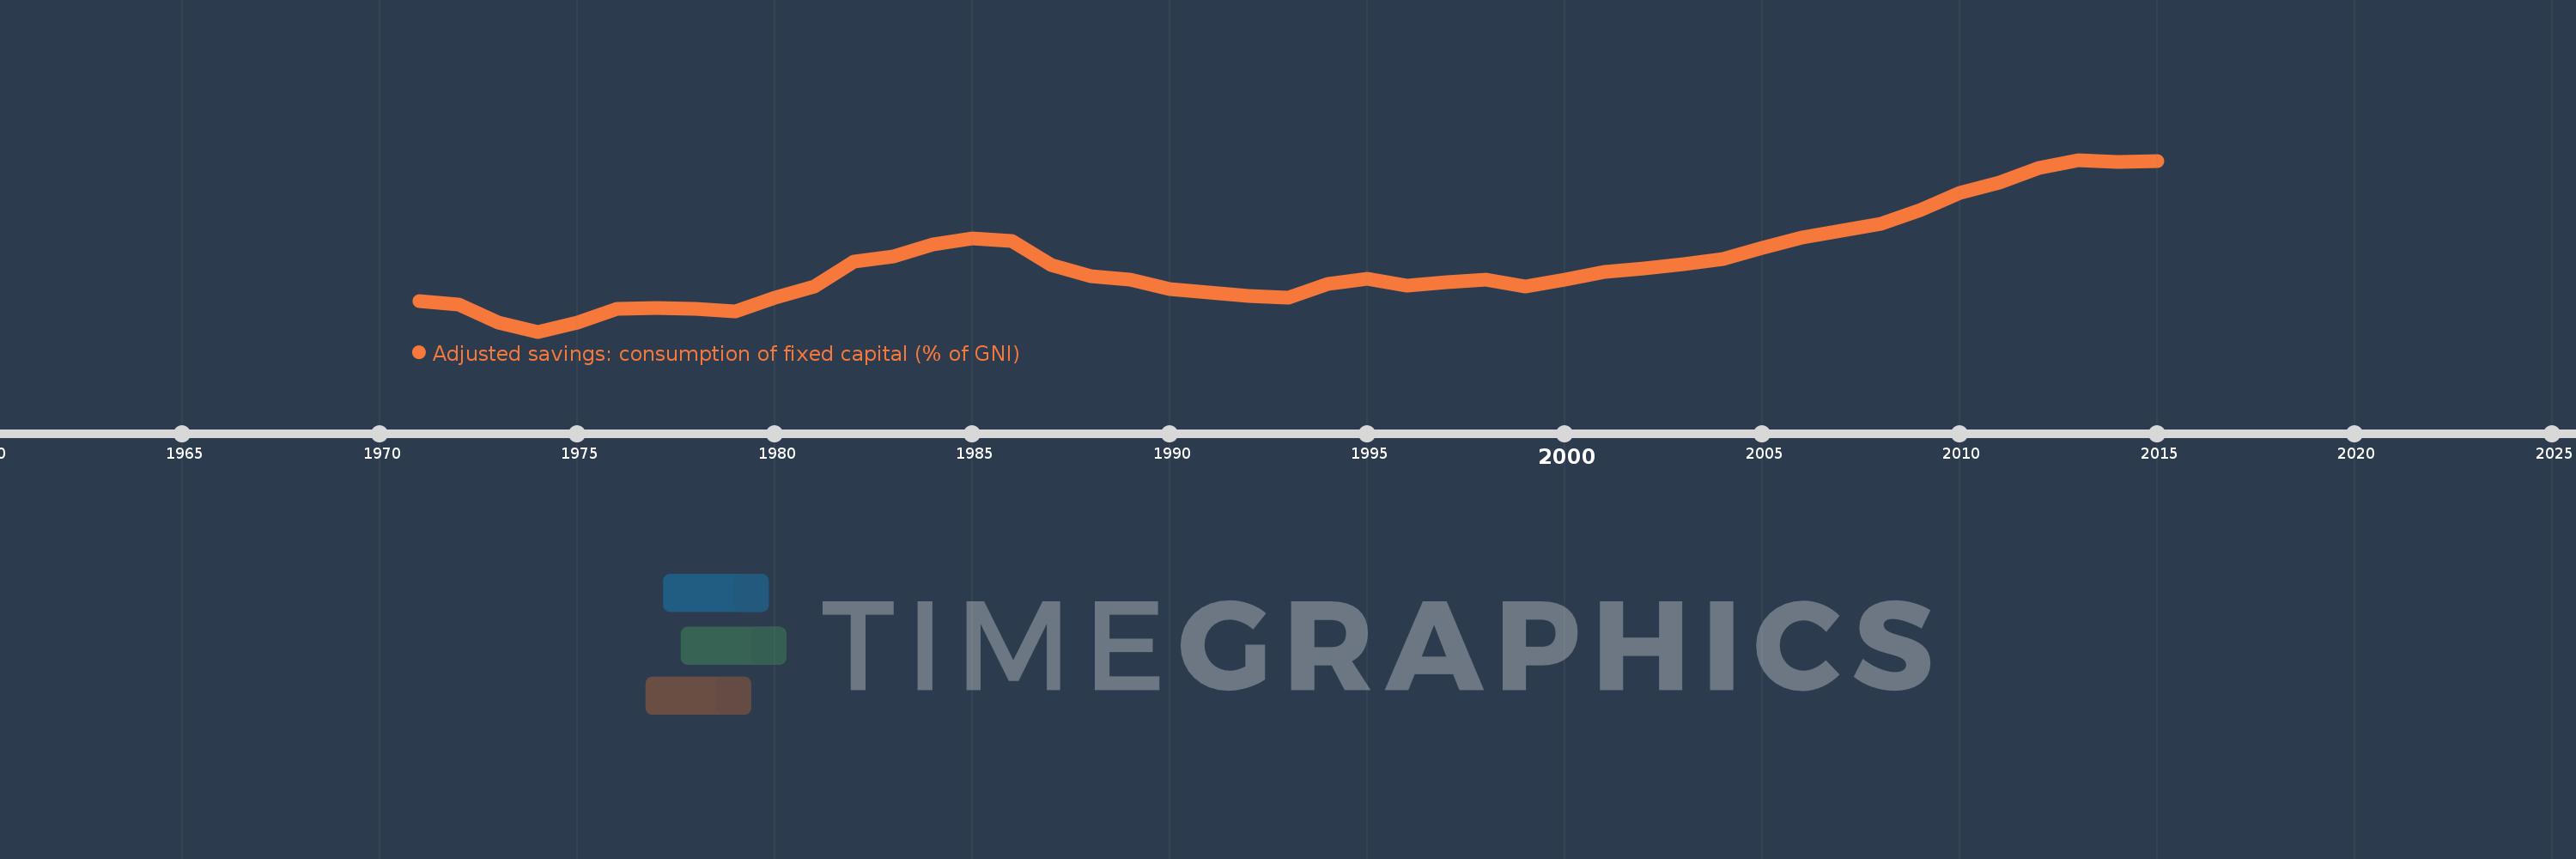
Adjusted savings: consumption of fixed capital (% of GNI)
2015,2014,2013,2012,2011,2010,2009,2008,2007,2006,2005,2004,2003,2002,2001,2000,1999,1998,1997,1996,1995,1994,1993,1992,1991,1990,1989,1988,1987,1986,1985,1984,1983,1982,1981,1980,1979,1978,1977,1976,1975,1974,1973,1972,1971
This statistics in other country:
AfghanistanAlbaniaAlgeriaAndorraAngolaAntigua and BarbudaArab WorldArgentinaArmeniaAustraliaAustriaAzerbaijanBahamas, TheBahrainBangladeshBarbadosBelarusBelgiumBelizeBeninBermudaBhutanBoliviaBosnia and HerzegovinaBotswanaBrazilBrunei DarussalamBulgariaBurkina FasoBurundiCabo VerdeCambodiaCameroonCanadaCaribbean small statesCentral African RepublicCentral Europe and the BalticsChadChileChinaColombiaComorosCongo, Dem. Rep.Congo, Rep.Costa RicaCote d'IvoireCroatiaCubaCyprusCzech RepublicDenmarkDjiboutiDominicaDominican RepublicEarly-demographic dividendEast Asia & PacificEast Asia & Pacific (excluding high income)East Asia & Pacific (IDA & IBRD countries)EcuadorEgypt, Arab Rep.El SalvadorEquatorial GuineaEritreaEstoniaEthiopiaEuro areaEurope & Central AsiaEurope & Central Asia (excluding high income)Europe & Central Asia (IDA & IBRD countries)European UnionFijiFinlandFragile and conflict affected situationsFranceGabonGambia, TheGeorgiaGermanyGhanaGreeceGreenlandGrenadaGuatemalaGuineaGuinea-BissauGuyanaHaitiHeavily indebted poor countries (HIPC)High incomeHondurasHong Kong SAR, ChinaHungaryIBRD onlyIcelandIDA & IBRD totalIDA blendIDA onlyIDA totalIndiaIndonesiaIran, Islamic Rep.IraqIrelandIsraelItalyJamaicaJapanJordanKazakhstanKenyaKiribatiKorea, Rep.KosovoKuwaitKyrgyz RepublicLao PDRLate-demographic dividendLatin America & Caribbean Latin America & Caribbean (excluding high income)Latin America & the Caribbean (IDA & IBRD countries)LatviaLeast developed countries: UN classificationLebanonLesothoLiberiaLibyaLiechtensteinLithuaniaLow & middle incomeLow incomeLower middle incomeLuxembourgMacao SAR, ChinaMacedonia, FYRMadagascarMalawiMalaysiaMaldivesMaliMaltaMarshall IslandsMauritaniaMauritiusMexicoMicronesia, Fed. Sts.Middle East & North AfricaMiddle East & North Africa (excluding high income)Middle East & North Africa (IDA & IBRD countries)Middle incomeMoldovaMonacoMongoliaMontenegroMoroccoMozambiqueMyanmarNamibiaNepalNetherlandsNew ZealandNicaraguaNigerNigeriaNorth AmericaNorwayOECD membersOmanOther small statesPacific island small statesPakistanPalauPanamaPapua New GuineaParaguayPeruPhilippinesPolandPortugalPost-demographic dividendPre-demographic dividendPuerto RicoQatarRomaniaRussian FederationRwandaSamoaSan MarinoSao Tome and PrincipeSaudi ArabiaSenegalSerbiaSeychellesSierra LeoneSingaporeSlovak RepublicSloveniaSmall statesSolomon IslandsSouth AfricaSouth AsiaSouth Asia (IDA & IBRD)SpainSri LankaSt. Kitts and NevisSt. LuciaSt. Vincent and the GrenadinesSub-Saharan Africa Sub-Saharan Africa (excluding high income)Sub-Saharan Africa (IDA & IBRD countries)SudanSurinameSwazilandSwedenSwitzerlandSyrian Arab RepublicTajikistanTanzaniaThailandTimor-LesteTogoTongaTrinidad and TobagoTunisiaTurkeyTurkmenistanTuvaluUgandaUkraineUnited Arab EmiratesUnited KingdomUnited StatesUpper middle incomeUruguayUzbekistanVanuatuVenezuela, RBVietnamWest Bank and GazaWorldYemen, Rep.ZambiaZimbabwe Timeline:
This timeline shows a graph from 1971 to 2015 of Spain. No data until 1970. Number of actual observations by date: 45.
Source name:
World Development Indicators
Source organization:
World Bank staff estimates using data from the United Nations Statistics Division's National Accounts Statistics.
Categories, topics:
Economy & Growth, Environment
Last updated:
apr 23, 2017
Indicators value changes by year
Minimum:
11.388
jan 1, 1974
Maximum:
17.964
jan 1, 2013
At the date of observation
Value
Absolute change
Change from previous value
jan 1, 1971
12.557
+12.557
0.0%
jan 1, 1972
12.427
-0.129
-1.03%
jan 1, 1973
11.733
-0.694
-5.58%
jan 1, 1974
11.388
-0.345
-2.94%
jan 1, 1975
11.744
+0.356
3.13%
jan 1, 1976
12.262
+0.518
4.41%
jan 1, 1977
12.283
+0.021
0.17%
jan 1, 1978
12.264
-0.02
-0.16%
jan 1, 1979
12.177
-0.086
-0.71%
jan 1, 1980
12.685
+0.508
4.17%
jan 1, 1981
13.128
+0.443
3.5%
jan 1, 1982
14.058
+0.93
7.08%
jan 1, 1983
14.281
+0.223
1.58%
jan 1, 1984
14.715
+0.435
3.04%
jan 1, 1985
14.968
+0.252
1.71%
jan 1, 1986
14.854
-0.114
-0.76%
jan 1, 1987
13.939
-0.915
-6.16%
jan 1, 1988
13.496
-0.443
-3.18%
jan 1, 1989
13.369
-0.127
-0.94%
jan 1, 1990
13.012
-0.356
-2.67%
jan 1, 1991
12.876
-0.136
-1.05%
jan 1, 1992
12.752
-0.124
-0.96%
jan 1, 1993
12.694
-0.058
-0.46%
jan 1, 1994
13.222
+0.529
4.16%
jan 1, 1995
13.404
+0.182
1.38%
jan 1, 1996
13.139
-0.266
-1.98%
jan 1, 1997
13.268
+0.129
0.98%
jan 1, 1998
13.386
+0.118
0.89%
jan 1, 1999
13.118
-0.268
-2.0%
jan 1, 2000
13.385
+0.268
2.04%
jan 1, 2001
13.668
+0.283
2.11%
jan 1, 2002
13.796
+0.128
0.93%
jan 1, 2003
13.984
+0.188
1.36%
jan 1, 2004
14.158
+0.174
1.24%
jan 1, 2005
14.608
+0.45
3.18%
jan 1, 2006
14.994
+0.386
2.64%
jan 1, 2007
15.261
+0.267
1.78%
jan 1, 2008
15.527
+0.266
1.74%
jan 1, 2009
16.042
+0.515
3.31%
jan 1, 2010
16.71
+0.668
4.16%
jan 1, 2011
17.079
+0.369
2.21%
jan 1, 2012
17.661
+0.581
3.4%
jan 1, 2013
17.964
+0.304
1.72%
jan 1, 2014
17.868
-0.097
-0.54%
jan 1, 2015
17.922
+0.055
0.31%
Ranking of countries by current statistics by years


Comments: