29
/
en
AIzaSyAYiBZKx7MnpbEhh9jyipgxe19OcubqV5w
April 1, 2024
252647
Sudan
SDN
true
2
1
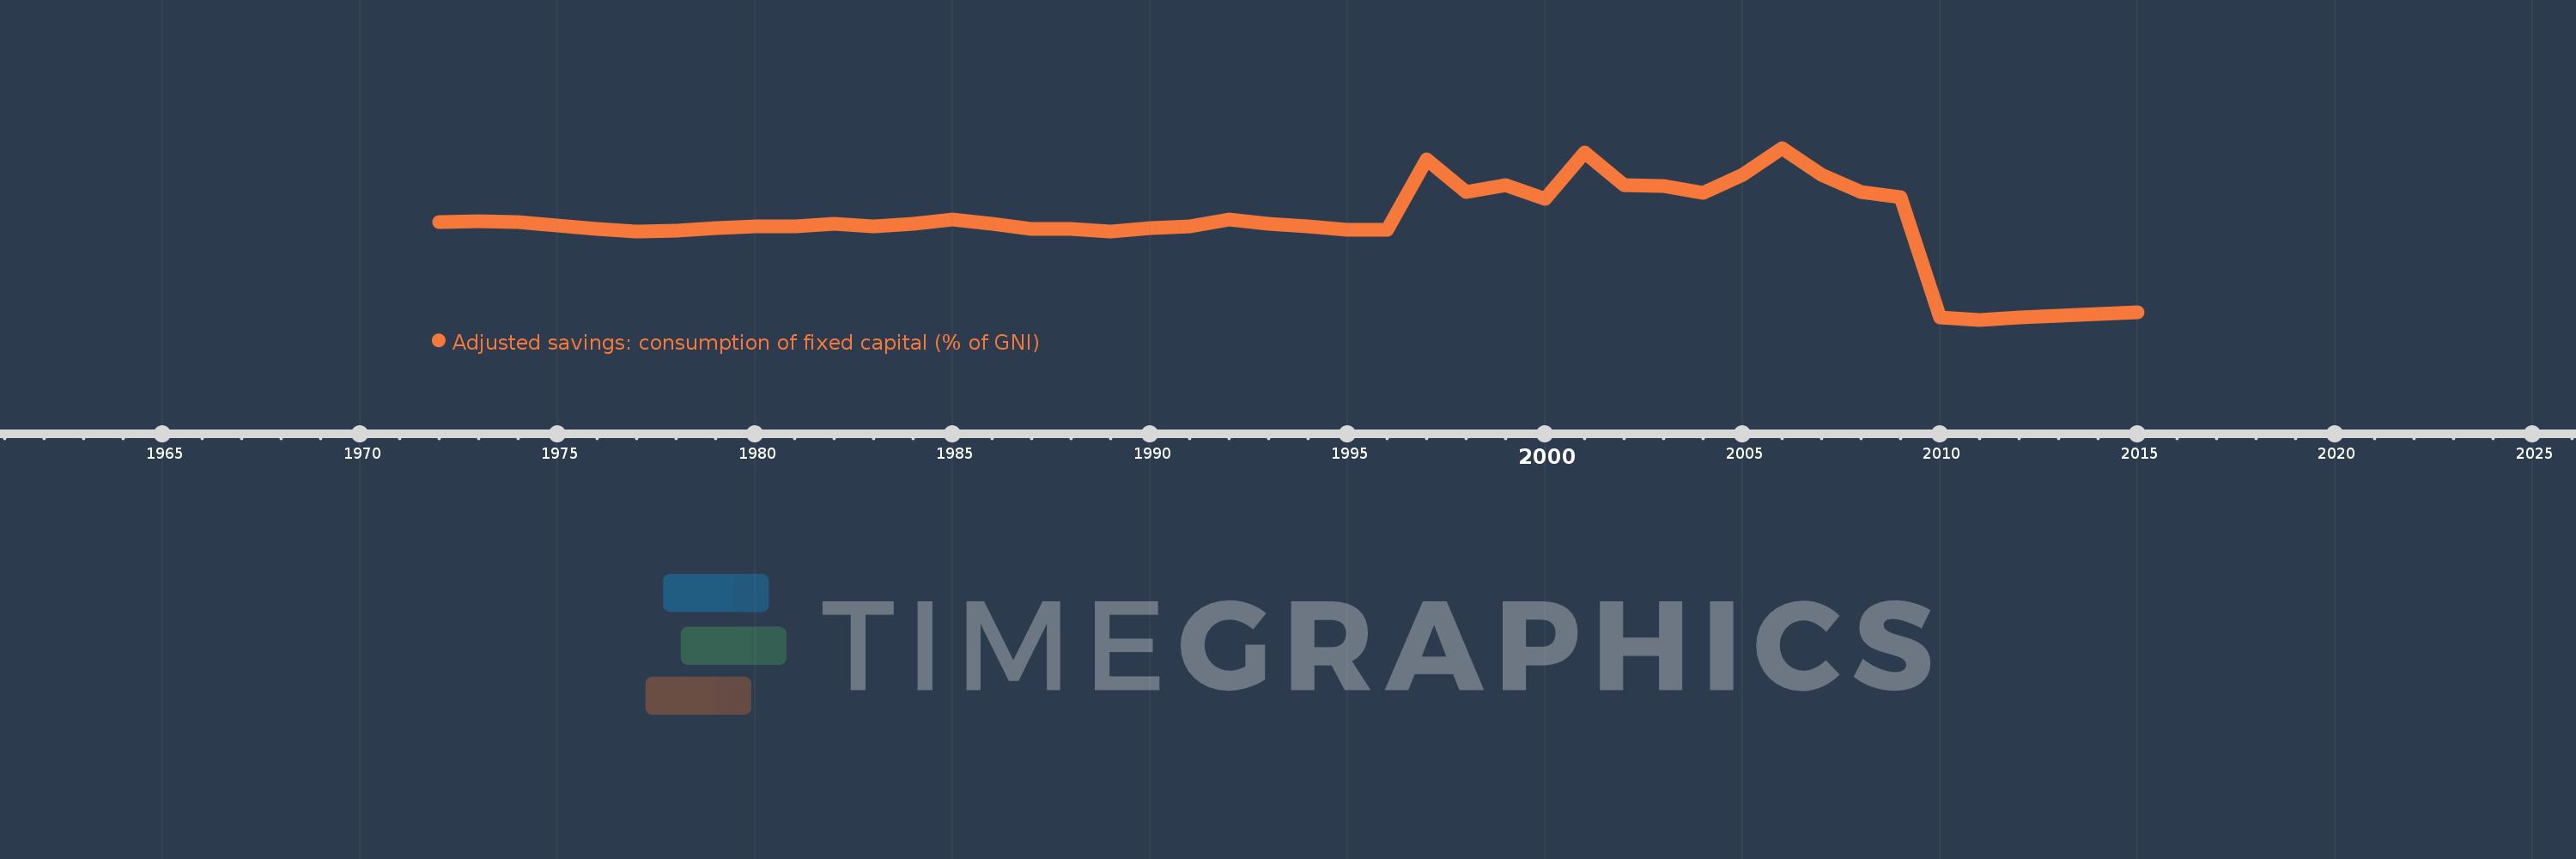
Adjusted savings: consumption of fixed capital (% of GNI)
2015,2014,2013,2012,2011,2010,2009,2008,2007,2006,2005,2004,2003,2002,2001,2000,1999,1998,1997,1996,1995,1994,1993,1992,1991,1990,1989,1988,1987,1986,1985,1984,1983,1982,1981,1980,1979,1978,1977,1976,1975,1974,1973,1972
This statistics in other country:
AfghanistanAlbaniaAlgeriaAndorraAngolaAntigua and BarbudaArab WorldArgentinaArmeniaAustraliaAustriaAzerbaijanBahamas, TheBahrainBangladeshBarbadosBelarusBelgiumBelizeBeninBermudaBhutanBoliviaBosnia and HerzegovinaBotswanaBrazilBrunei DarussalamBulgariaBurkina FasoBurundiCabo VerdeCambodiaCameroonCanadaCaribbean small statesCentral African RepublicCentral Europe and the BalticsChadChileChinaColombiaComorosCongo, Dem. Rep.Congo, Rep.Costa RicaCote d'IvoireCroatiaCubaCyprusCzech RepublicDenmarkDjiboutiDominicaDominican RepublicEarly-demographic dividendEast Asia & PacificEast Asia & Pacific (excluding high income)East Asia & Pacific (IDA & IBRD countries)EcuadorEgypt, Arab Rep.El SalvadorEquatorial GuineaEritreaEstoniaEthiopiaEuro areaEurope & Central AsiaEurope & Central Asia (excluding high income)Europe & Central Asia (IDA & IBRD countries)European UnionFijiFinlandFragile and conflict affected situationsFranceGabonGambia, TheGeorgiaGermanyGhanaGreeceGreenlandGrenadaGuatemalaGuineaGuinea-BissauGuyanaHaitiHeavily indebted poor countries (HIPC)High incomeHondurasHong Kong SAR, ChinaHungaryIBRD onlyIcelandIDA & IBRD totalIDA blendIDA onlyIDA totalIndiaIndonesiaIran, Islamic Rep.IraqIrelandIsraelItalyJamaicaJapanJordanKazakhstanKenyaKiribatiKorea, Rep.KosovoKuwaitKyrgyz RepublicLao PDRLate-demographic dividendLatin America & Caribbean Latin America & Caribbean (excluding high income)Latin America & the Caribbean (IDA & IBRD countries)LatviaLeast developed countries: UN classificationLebanonLesothoLiberiaLibyaLiechtensteinLithuaniaLow & middle incomeLow incomeLower middle incomeLuxembourgMacao SAR, ChinaMacedonia, FYRMadagascarMalawiMalaysiaMaldivesMaliMaltaMarshall IslandsMauritaniaMauritiusMexicoMicronesia, Fed. Sts.Middle East & North AfricaMiddle East & North Africa (excluding high income)Middle East & North Africa (IDA & IBRD countries)Middle incomeMoldovaMonacoMongoliaMontenegroMoroccoMozambiqueMyanmarNamibiaNepalNetherlandsNew ZealandNicaraguaNigerNigeriaNorth AmericaNorwayOECD membersOmanOther small statesPacific island small statesPakistanPalauPanamaPapua New GuineaParaguayPeruPhilippinesPolandPortugalPost-demographic dividendPre-demographic dividendPuerto RicoQatarRomaniaRussian FederationRwandaSamoaSan MarinoSao Tome and PrincipeSaudi ArabiaSenegalSerbiaSeychellesSierra LeoneSingaporeSlovak RepublicSloveniaSmall statesSolomon IslandsSouth AfricaSouth AsiaSouth Asia (IDA & IBRD)SpainSri LankaSt. Kitts and NevisSt. LuciaSt. Vincent and the GrenadinesSub-Saharan Africa Sub-Saharan Africa (excluding high income)Sub-Saharan Africa (IDA & IBRD countries)SudanSurinameSwazilandSwedenSwitzerlandSyrian Arab RepublicTajikistanTanzaniaThailandTimor-LesteTogoTongaTrinidad and TobagoTunisiaTurkeyTurkmenistanTuvaluUgandaUkraineUnited Arab EmiratesUnited KingdomUnited StatesUpper middle incomeUruguayUzbekistanVanuatuVenezuela, RBVietnamWest Bank and GazaWorldYemen, Rep.ZambiaZimbabwe Timeline:
This timeline shows a graph from 1972 to 2015 of Sudan. No data until 1971. Number of actual observations by date: 44.
Source name:
World Development Indicators
Source organization:
World Bank staff estimates using data from the United Nations Statistics Division's National Accounts Statistics.
Categories, topics:
Economy & Growth, Environment
Last updated:
apr 23, 2017
Indicators value changes by year
At the date of observation
Value
Absolute change
Change from previous value
jan 1, 1972
6.153
+6.153
0.0%
jan 1, 1973
6.211
+0.058
0.94%
jan 1, 1974
6.138
-0.073
-1.17%
jan 1, 1975
5.989
-0.149
-2.43%
jan 1, 1976
5.822
-0.166
-2.78%
jan 1, 1977
5.725
-0.098
-1.68%
jan 1, 1978
5.751
+0.027
0.47%
jan 1, 1979
5.866
+0.115
1.99%
jan 1, 1980
5.964
+0.098
1.67%
jan 1, 1981
5.965
+0.001
0.02%
jan 1, 1982
6.085
+0.12
2.01%
jan 1, 1983
5.97
-0.114
-1.88%
jan 1, 1984
6.074
+0.103
1.73%
jan 1, 1985
6.294
+0.22
3.63%
jan 1, 1986
6.077
-0.217
-3.45%
jan 1, 1987
5.849
-0.228
-3.75%
jan 1, 1988
5.829
-0.02
-0.34%
jan 1, 1989
5.726
-0.102
-1.76%
jan 1, 1990
5.87
+0.144
2.51%
jan 1, 1991
5.936
+0.066
1.12%
jan 1, 1992
6.27
+0.335
5.64%
jan 1, 1993
6.062
-0.209
-3.33%
jan 1, 1994
5.962
-0.1
-1.65%
jan 1, 1995
5.787
-0.174
-2.92%
jan 1, 1996
5.784
-0.003
-0.06%
jan 1, 1997
9.113
+3.329
57.55%
jan 1, 1998
7.563
-1.55
-17.01%
jan 1, 1999
7.87
+0.307
4.06%
jan 1, 2000
7.248
-0.622
-7.91%
jan 1, 2001
9.412
+2.165
29.87%
jan 1, 2002
7.902
-1.51
-16.04%
jan 1, 2003
7.86
-0.042
-0.53%
jan 1, 2004
7.509
-0.351
-4.46%
jan 1, 2005
8.354
+0.845
11.25%
jan 1, 2006
9.635
+1.281
15.33%
jan 1, 2007
8.363
-1.272
-13.2%
jan 1, 2008
7.554
-0.809
-9.68%
jan 1, 2009
7.34
-0.214
-2.83%
jan 1, 2010
1.671
-5.669
-77.24%
jan 1, 2011
1.568
-0.103
-6.15%
jan 1, 2012
1.678
+0.11
7.03%
jan 1, 2013
1.752
+0.074
4.38%
jan 1, 2014
1.835
+0.084
4.77%
jan 1, 2015
1.901
+0.066
3.6%
Ranking of countries by current statistics by years


Comments: