29
/
en
AIzaSyAYiBZKx7MnpbEhh9jyipgxe19OcubqV5w
April 1, 2024
160182
Israel
ISR
true
2
1
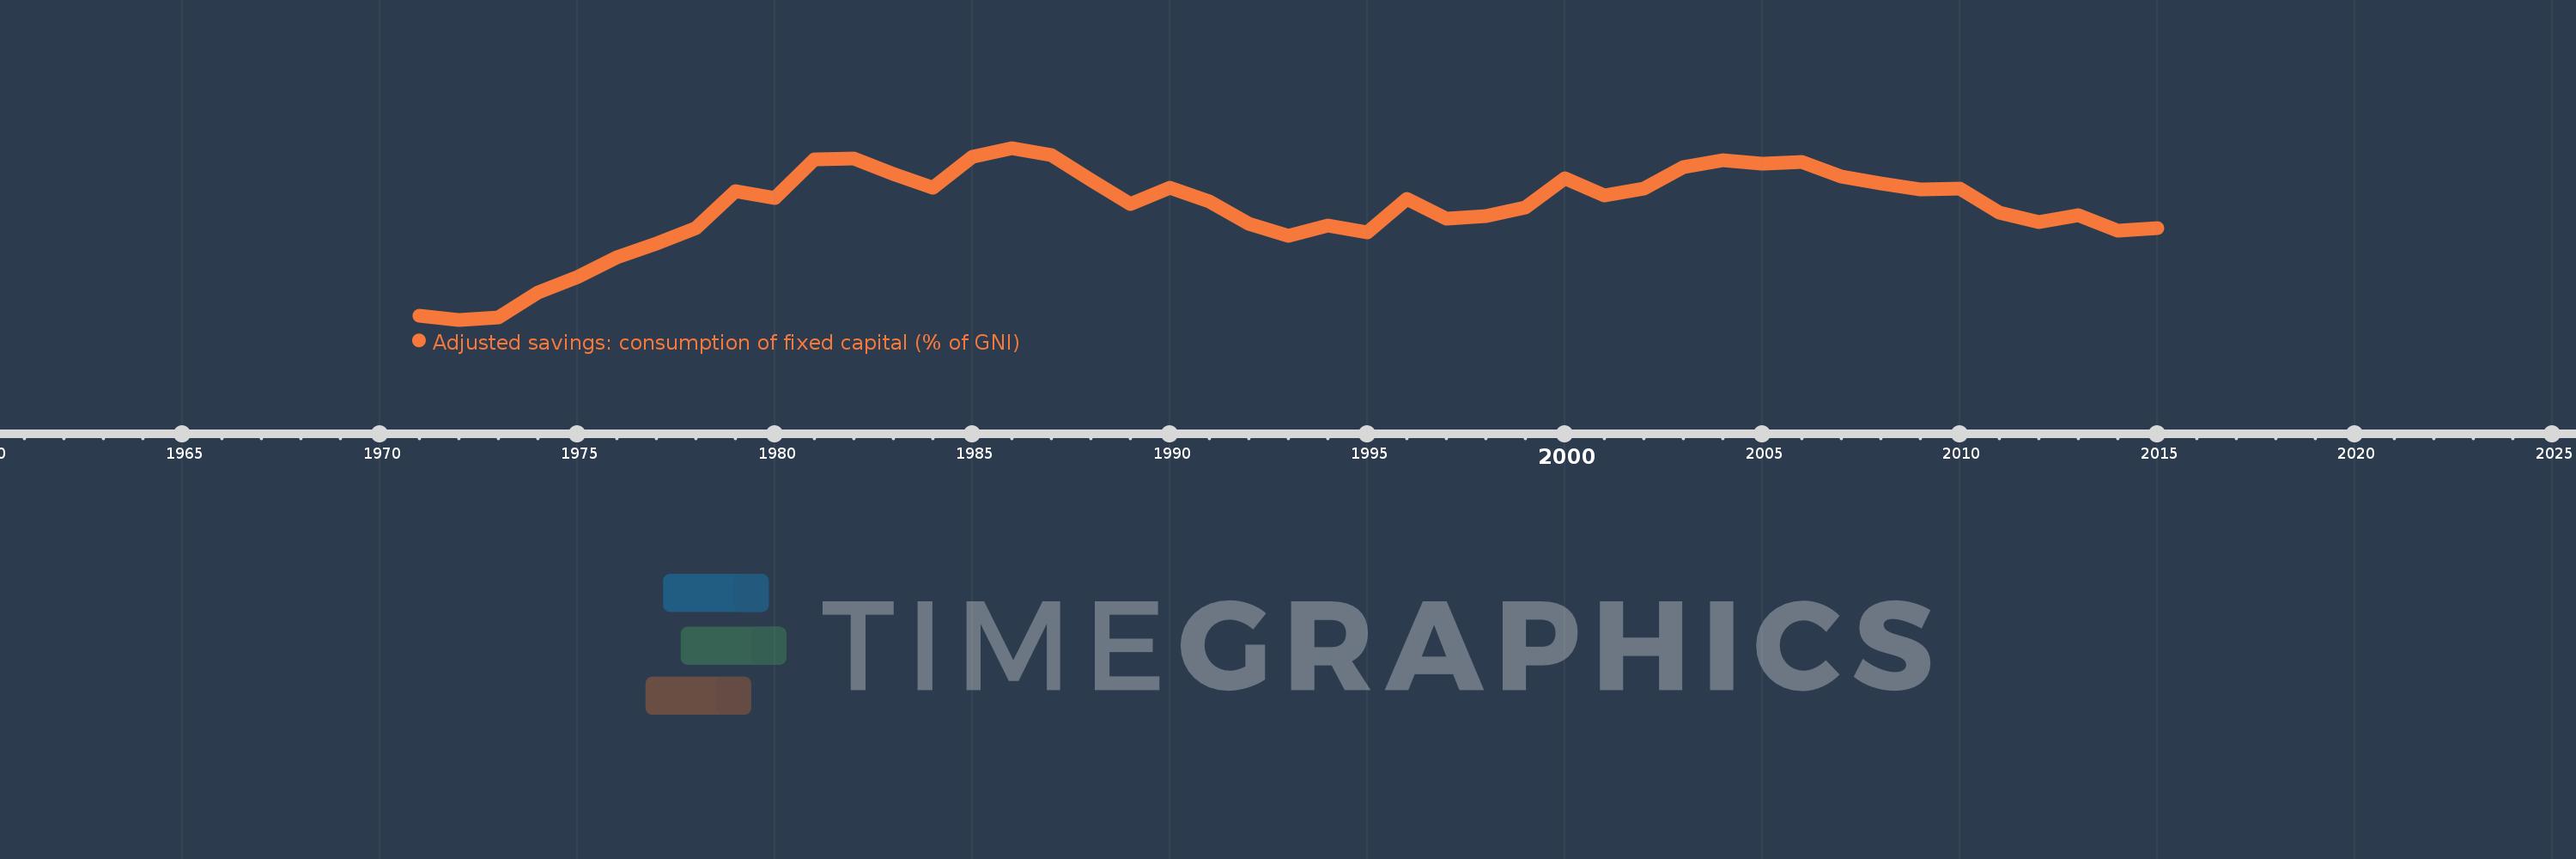
Adjusted savings: consumption of fixed capital (% of GNI)
2015,2014,2013,2012,2011,2010,2009,2008,2007,2006,2005,2004,2003,2002,2001,2000,1999,1998,1997,1996,1995,1994,1993,1992,1991,1990,1989,1988,1987,1986,1985,1984,1983,1982,1981,1980,1979,1978,1977,1976,1975,1974,1973,1972,1971
This statistics in other country:
AfghanistanAlbaniaAlgeriaAndorraAngolaAntigua and BarbudaArab WorldArgentinaArmeniaAustraliaAustriaAzerbaijanBahamas, TheBahrainBangladeshBarbadosBelarusBelgiumBelizeBeninBermudaBhutanBoliviaBosnia and HerzegovinaBotswanaBrazilBrunei DarussalamBulgariaBurkina FasoBurundiCabo VerdeCambodiaCameroonCanadaCaribbean small statesCentral African RepublicCentral Europe and the BalticsChadChileChinaColombiaComorosCongo, Dem. Rep.Congo, Rep.Costa RicaCote d'IvoireCroatiaCubaCyprusCzech RepublicDenmarkDjiboutiDominicaDominican RepublicEarly-demographic dividendEast Asia & PacificEast Asia & Pacific (excluding high income)East Asia & Pacific (IDA & IBRD countries)EcuadorEgypt, Arab Rep.El SalvadorEquatorial GuineaEritreaEstoniaEthiopiaEuro areaEurope & Central AsiaEurope & Central Asia (excluding high income)Europe & Central Asia (IDA & IBRD countries)European UnionFijiFinlandFragile and conflict affected situationsFranceGabonGambia, TheGeorgiaGermanyGhanaGreeceGreenlandGrenadaGuatemalaGuineaGuinea-BissauGuyanaHaitiHeavily indebted poor countries (HIPC)High incomeHondurasHong Kong SAR, ChinaHungaryIBRD onlyIcelandIDA & IBRD totalIDA blendIDA onlyIDA totalIndiaIndonesiaIran, Islamic Rep.IraqIrelandIsraelItalyJamaicaJapanJordanKazakhstanKenyaKiribatiKorea, Rep.KosovoKuwaitKyrgyz RepublicLao PDRLate-demographic dividendLatin America & Caribbean Latin America & Caribbean (excluding high income)Latin America & the Caribbean (IDA & IBRD countries)LatviaLeast developed countries: UN classificationLebanonLesothoLiberiaLibyaLiechtensteinLithuaniaLow & middle incomeLow incomeLower middle incomeLuxembourgMacao SAR, ChinaMacedonia, FYRMadagascarMalawiMalaysiaMaldivesMaliMaltaMarshall IslandsMauritaniaMauritiusMexicoMicronesia, Fed. Sts.Middle East & North AfricaMiddle East & North Africa (excluding high income)Middle East & North Africa (IDA & IBRD countries)Middle incomeMoldovaMonacoMongoliaMontenegroMoroccoMozambiqueMyanmarNamibiaNepalNetherlandsNew ZealandNicaraguaNigerNigeriaNorth AmericaNorwayOECD membersOmanOther small statesPacific island small statesPakistanPalauPanamaPapua New GuineaParaguayPeruPhilippinesPolandPortugalPost-demographic dividendPre-demographic dividendPuerto RicoQatarRomaniaRussian FederationRwandaSamoaSan MarinoSao Tome and PrincipeSaudi ArabiaSenegalSerbiaSeychellesSierra LeoneSingaporeSlovak RepublicSloveniaSmall statesSolomon IslandsSouth AfricaSouth AsiaSouth Asia (IDA & IBRD)SpainSri LankaSt. Kitts and NevisSt. LuciaSt. Vincent and the GrenadinesSub-Saharan Africa Sub-Saharan Africa (excluding high income)Sub-Saharan Africa (IDA & IBRD countries)SudanSurinameSwazilandSwedenSwitzerlandSyrian Arab RepublicTajikistanTanzaniaThailandTimor-LesteTogoTongaTrinidad and TobagoTunisiaTurkeyTurkmenistanTuvaluUgandaUkraineUnited Arab EmiratesUnited KingdomUnited StatesUpper middle incomeUruguayUzbekistanVanuatuVenezuela, RBVietnamWest Bank and GazaWorldYemen, Rep.ZambiaZimbabwe Timeline:
This timeline shows a graph from 1971 to 2015 of Israel. No data until 1970. Number of actual observations by date: 45.
Source name:
World Development Indicators
Source organization:
World Bank staff estimates using data from the United Nations Statistics Division's National Accounts Statistics.
Categories, topics:
Economy & Growth, Environment
Last updated:
apr 23, 2017
Indicators value changes by year
Minimum:
10.214
jan 1, 1972
Maximum:
16.351
jan 1, 1986
At the date of observation
Value
Absolute change
Change from previous value
jan 1, 1971
10.355
+10.355
0.0%
jan 1, 1972
10.214
-0.141
-1.36%
jan 1, 1973
10.297
+0.083
0.81%
jan 1, 1974
11.19
+0.893
8.67%
jan 1, 1975
11.729
+0.539
4.82%
jan 1, 1976
12.45
+0.721
6.14%
jan 1, 1977
12.94
+0.49
3.94%
jan 1, 1978
13.491
+0.551
4.26%
jan 1, 1979
14.809
+1.318
9.77%
jan 1, 1980
14.569
-0.24
-1.62%
jan 1, 1981
15.954
+1.384
9.5%
jan 1, 1982
15.982
+0.028
0.18%
jan 1, 1983
15.434
-0.548
-3.43%
jan 1, 1984
14.923
-0.511
-3.31%
jan 1, 1985
16.022
+1.1
7.37%
jan 1, 1986
16.351
+0.328
2.05%
jan 1, 1987
16.081
-0.27
-1.65%
jan 1, 1988
15.214
-0.867
-5.39%
jan 1, 1989
14.353
-0.861
-5.66%
jan 1, 1990
14.922
+0.569
3.96%
jan 1, 1991
14.43
-0.492
-3.3%
jan 1, 1992
13.643
-0.788
-5.46%
jan 1, 1993
13.217
-0.426
-3.12%
jan 1, 1994
13.579
+0.362
2.74%
jan 1, 1995
13.343
-0.236
-1.74%
jan 1, 1996
14.538
+1.196
8.96%
jan 1, 1997
13.825
-0.713
-4.9%
jan 1, 1998
13.915
+0.09
0.65%
jan 1, 1999
14.234
+0.319
2.29%
jan 1, 2000
15.281
+1.047
7.36%
jan 1, 2001
14.665
-0.616
-4.03%
jan 1, 2002
14.89
+0.224
1.53%
jan 1, 2003
15.656
+0.766
5.15%
jan 1, 2004
15.917
+0.261
1.67%
jan 1, 2005
15.778
-0.139
-0.87%
jan 1, 2006
15.836
+0.058
0.37%
jan 1, 2007
15.339
-0.497
-3.14%
jan 1, 2008
15.079
-0.261
-1.7%
jan 1, 2009
14.865
-0.214
-1.42%
jan 1, 2010
14.896
+0.031
0.21%
jan 1, 2011
14.036
-0.86
-5.77%
jan 1, 2012
13.707
-0.328
-2.34%
jan 1, 2013
13.943
+0.236
1.72%
jan 1, 2014
13.39
-0.553
-3.96%
jan 1, 2015
13.48
+0.09
0.67%
Ranking of countries by current statistics by years


Comments: