29
/
en
AIzaSyAYiBZKx7MnpbEhh9jyipgxe19OcubqV5w
April 1, 2024
146506
Guinea-Bissau
GNB
true
2
1
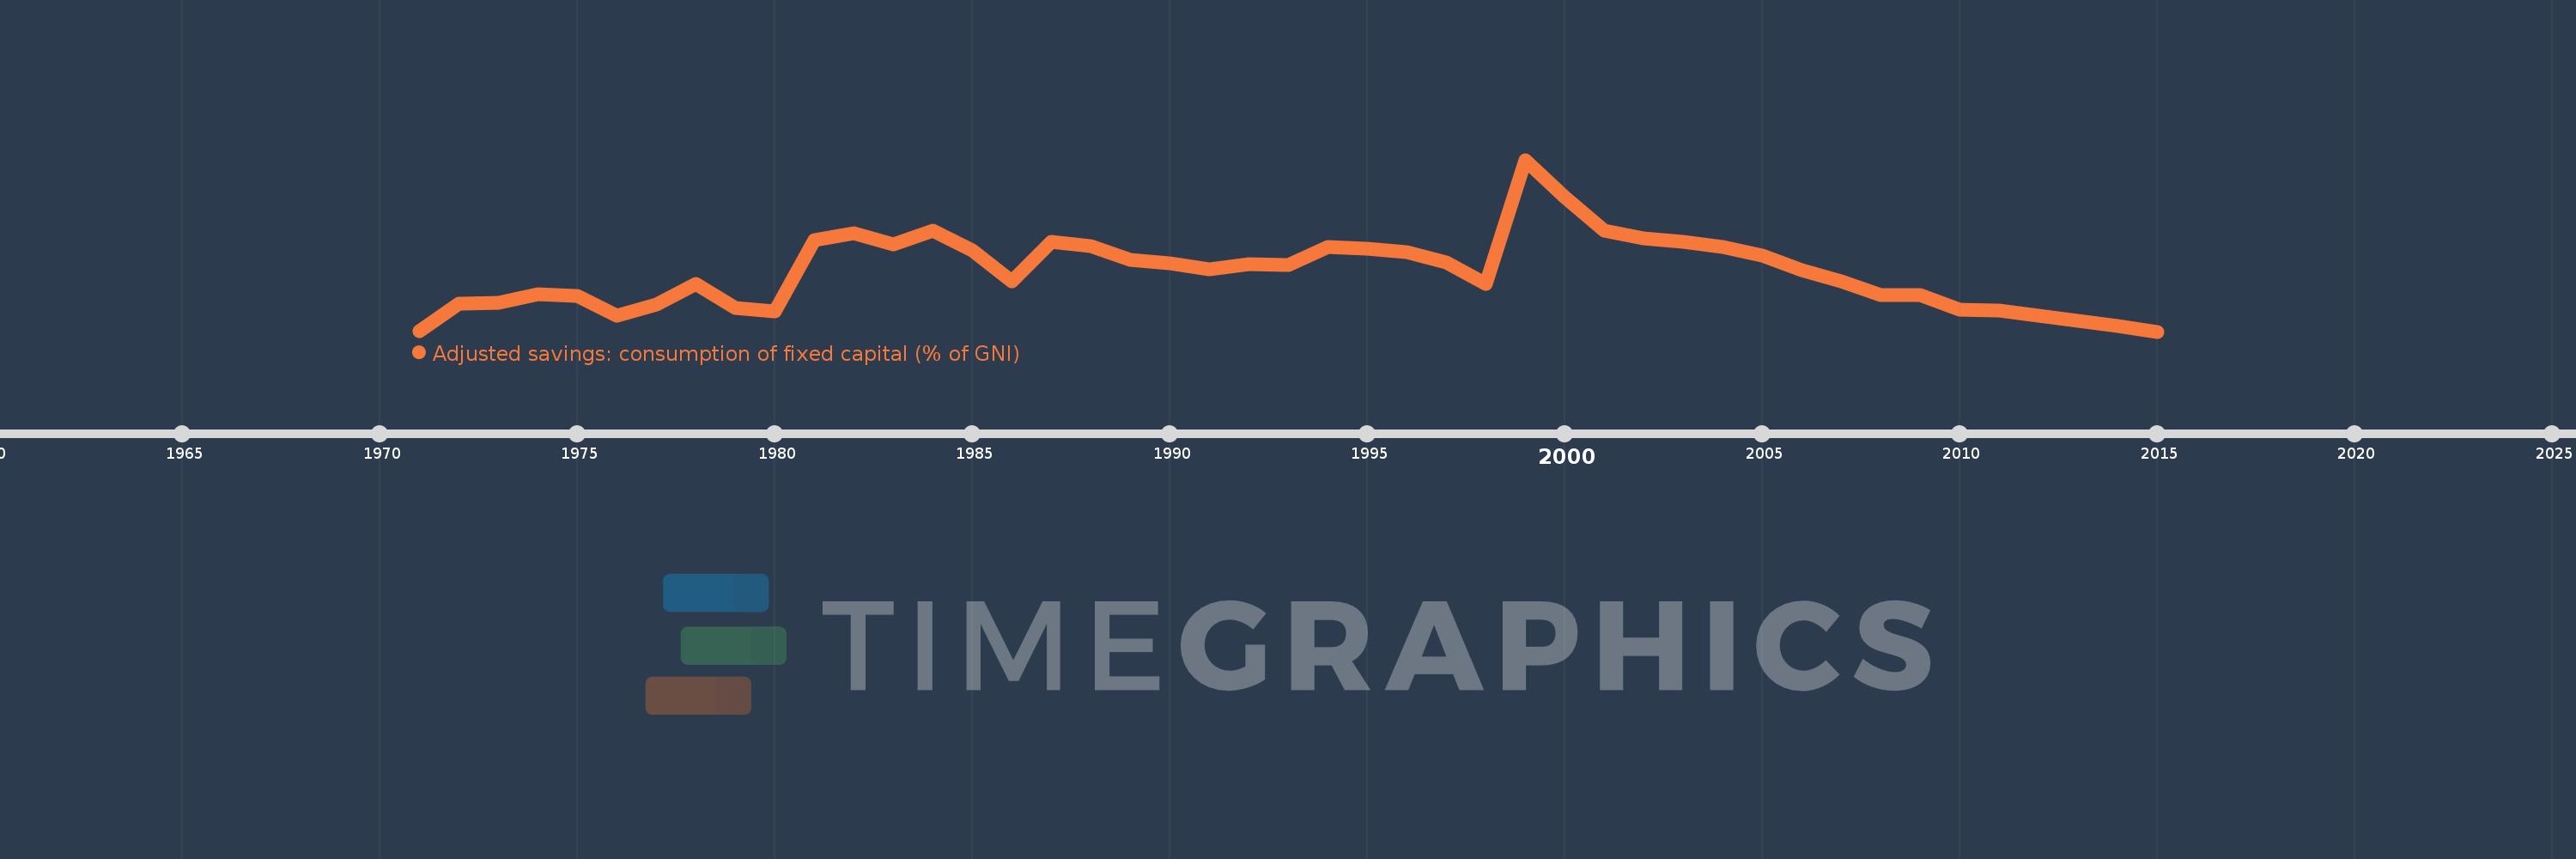
Adjusted savings: consumption of fixed capital (% of GNI)
2015,2014,2013,2012,2011,2010,2009,2008,2007,2006,2005,2004,2003,2002,2001,2000,1999,1998,1997,1996,1995,1994,1993,1992,1991,1990,1989,1988,1987,1986,1985,1984,1983,1982,1981,1980,1979,1978,1977,1976,1975,1974,1973,1972,1971
This statistics in other country:
AfghanistanAlbaniaAlgeriaAndorraAngolaAntigua and BarbudaArab WorldArgentinaArmeniaAustraliaAustriaAzerbaijanBahamas, TheBahrainBangladeshBarbadosBelarusBelgiumBelizeBeninBermudaBhutanBoliviaBosnia and HerzegovinaBotswanaBrazilBrunei DarussalamBulgariaBurkina FasoBurundiCabo VerdeCambodiaCameroonCanadaCaribbean small statesCentral African RepublicCentral Europe and the BalticsChadChileChinaColombiaComorosCongo, Dem. Rep.Congo, Rep.Costa RicaCote d'IvoireCroatiaCubaCyprusCzech RepublicDenmarkDjiboutiDominicaDominican RepublicEarly-demographic dividendEast Asia & PacificEast Asia & Pacific (excluding high income)East Asia & Pacific (IDA & IBRD countries)EcuadorEgypt, Arab Rep.El SalvadorEquatorial GuineaEritreaEstoniaEthiopiaEuro areaEurope & Central AsiaEurope & Central Asia (excluding high income)Europe & Central Asia (IDA & IBRD countries)European UnionFijiFinlandFragile and conflict affected situationsFranceGabonGambia, TheGeorgiaGermanyGhanaGreeceGreenlandGrenadaGuatemalaGuineaGuinea-BissauGuyanaHaitiHeavily indebted poor countries (HIPC)High incomeHondurasHong Kong SAR, ChinaHungaryIBRD onlyIcelandIDA & IBRD totalIDA blendIDA onlyIDA totalIndiaIndonesiaIran, Islamic Rep.IraqIrelandIsraelItalyJamaicaJapanJordanKazakhstanKenyaKiribatiKorea, Rep.KosovoKuwaitKyrgyz RepublicLao PDRLate-demographic dividendLatin America & Caribbean Latin America & Caribbean (excluding high income)Latin America & the Caribbean (IDA & IBRD countries)LatviaLeast developed countries: UN classificationLebanonLesothoLiberiaLibyaLiechtensteinLithuaniaLow & middle incomeLow incomeLower middle incomeLuxembourgMacao SAR, ChinaMacedonia, FYRMadagascarMalawiMalaysiaMaldivesMaliMaltaMarshall IslandsMauritaniaMauritiusMexicoMicronesia, Fed. Sts.Middle East & North AfricaMiddle East & North Africa (excluding high income)Middle East & North Africa (IDA & IBRD countries)Middle incomeMoldovaMonacoMongoliaMontenegroMoroccoMozambiqueMyanmarNamibiaNepalNetherlandsNew ZealandNicaraguaNigerNigeriaNorth AmericaNorwayOECD membersOmanOther small statesPacific island small statesPakistanPalauPanamaPapua New GuineaParaguayPeruPhilippinesPolandPortugalPost-demographic dividendPre-demographic dividendPuerto RicoQatarRomaniaRussian FederationRwandaSamoaSan MarinoSao Tome and PrincipeSaudi ArabiaSenegalSerbiaSeychellesSierra LeoneSingaporeSlovak RepublicSloveniaSmall statesSolomon IslandsSouth AfricaSouth AsiaSouth Asia (IDA & IBRD)SpainSri LankaSt. Kitts and NevisSt. LuciaSt. Vincent and the GrenadinesSub-Saharan Africa Sub-Saharan Africa (excluding high income)Sub-Saharan Africa (IDA & IBRD countries)SudanSurinameSwazilandSwedenSwitzerlandSyrian Arab RepublicTajikistanTanzaniaThailandTimor-LesteTogoTongaTrinidad and TobagoTunisiaTurkeyTurkmenistanTuvaluUgandaUkraineUnited Arab EmiratesUnited KingdomUnited StatesUpper middle incomeUruguayUzbekistanVanuatuVenezuela, RBVietnamWest Bank and GazaWorldYemen, Rep.ZambiaZimbabwe Timeline:
This timeline shows a graph from 1971 to 2015 of Guinea-Bissau. No data until 1970. Number of actual observations by date: 45.
Source name:
World Development Indicators
Source organization:
World Bank staff estimates using data from the United Nations Statistics Division's National Accounts Statistics.
Categories, topics:
Economy & Growth, Environment
Last updated:
apr 23, 2017
Indicators value changes by year
Maximum:
16.603
jan 1, 1999
At the date of observation
Value
Absolute change
Change from previous value
jan 1, 1971
9.308
+9.308
0.0%
jan 1, 1972
10.5
+1.191
12.8%
jan 1, 1973
10.533
+0.033
0.32%
jan 1, 1974
10.884
+0.351
3.33%
jan 1, 1975
10.806
-0.078
-0.72%
jan 1, 1976
9.962
-0.843
-7.81%
jan 1, 1977
10.453
+0.491
4.93%
jan 1, 1978
11.342
+0.889
8.5%
jan 1, 1979
10.305
-1.037
-9.15%
jan 1, 1980
10.156
-0.149
-1.44%
jan 1, 1981
13.2
+3.045
29.98%
jan 1, 1982
13.47
+0.27
2.05%
jan 1, 1983
13.007
-0.463
-3.44%
jan 1, 1984
13.605
+0.597
4.59%
jan 1, 1985
12.754
-0.851
-6.25%
jan 1, 1986
11.433
-1.32
-10.35%
jan 1, 1987
13.129
+1.696
14.83%
jan 1, 1988
12.946
-0.184
-1.4%
jan 1, 1989
12.338
-0.607
-4.69%
jan 1, 1990
12.204
-0.135
-1.09%
jan 1, 1991
11.939
-0.265
-2.17%
jan 1, 1992
12.173
+0.235
1.97%
jan 1, 1993
12.137
-0.036
-0.3%
jan 1, 1994
12.916
+0.779
6.42%
jan 1, 1995
12.825
-0.092
-0.71%
jan 1, 1996
12.688
-0.137
-1.07%
jan 1, 1997
12.254
-0.434
-3.42%
jan 1, 1998
11.323
-0.931
-7.6%
jan 1, 1999
16.603
+5.28
46.63%
jan 1, 2000
15.001
-1.602
-9.65%
jan 1, 2001
13.585
-1.416
-9.44%
jan 1, 2002
13.278
-0.307
-2.26%
jan 1, 2003
13.12
-0.158
-1.19%
jan 1, 2004
12.881
-0.239
-1.82%
jan 1, 2005
12.525
-0.357
-2.77%
jan 1, 2006
11.929
-0.596
-4.76%
jan 1, 2007
11.424
-0.505
-4.23%
jan 1, 2008
10.839
-0.585
-5.12%
jan 1, 2009
10.844
+0.006
0.05%
jan 1, 2010
10.217
-0.627
-5.78%
jan 1, 2011
10.198
-0.019
-0.18%
jan 1, 2012
9.992
-0.206
-2.02%
jan 1, 2013
9.766
-0.226
-2.26%
jan 1, 2014
9.536
-0.23
-2.36%
jan 1, 2015
9.304
-0.232
-2.43%
Ranking of countries by current statistics by years


Comments: