29
/
en
AIzaSyAYiBZKx7MnpbEhh9jyipgxe19OcubqV5w
April 1, 2024
27828
East Asia & Pacific (excluding high income)
EAP
false
2
1
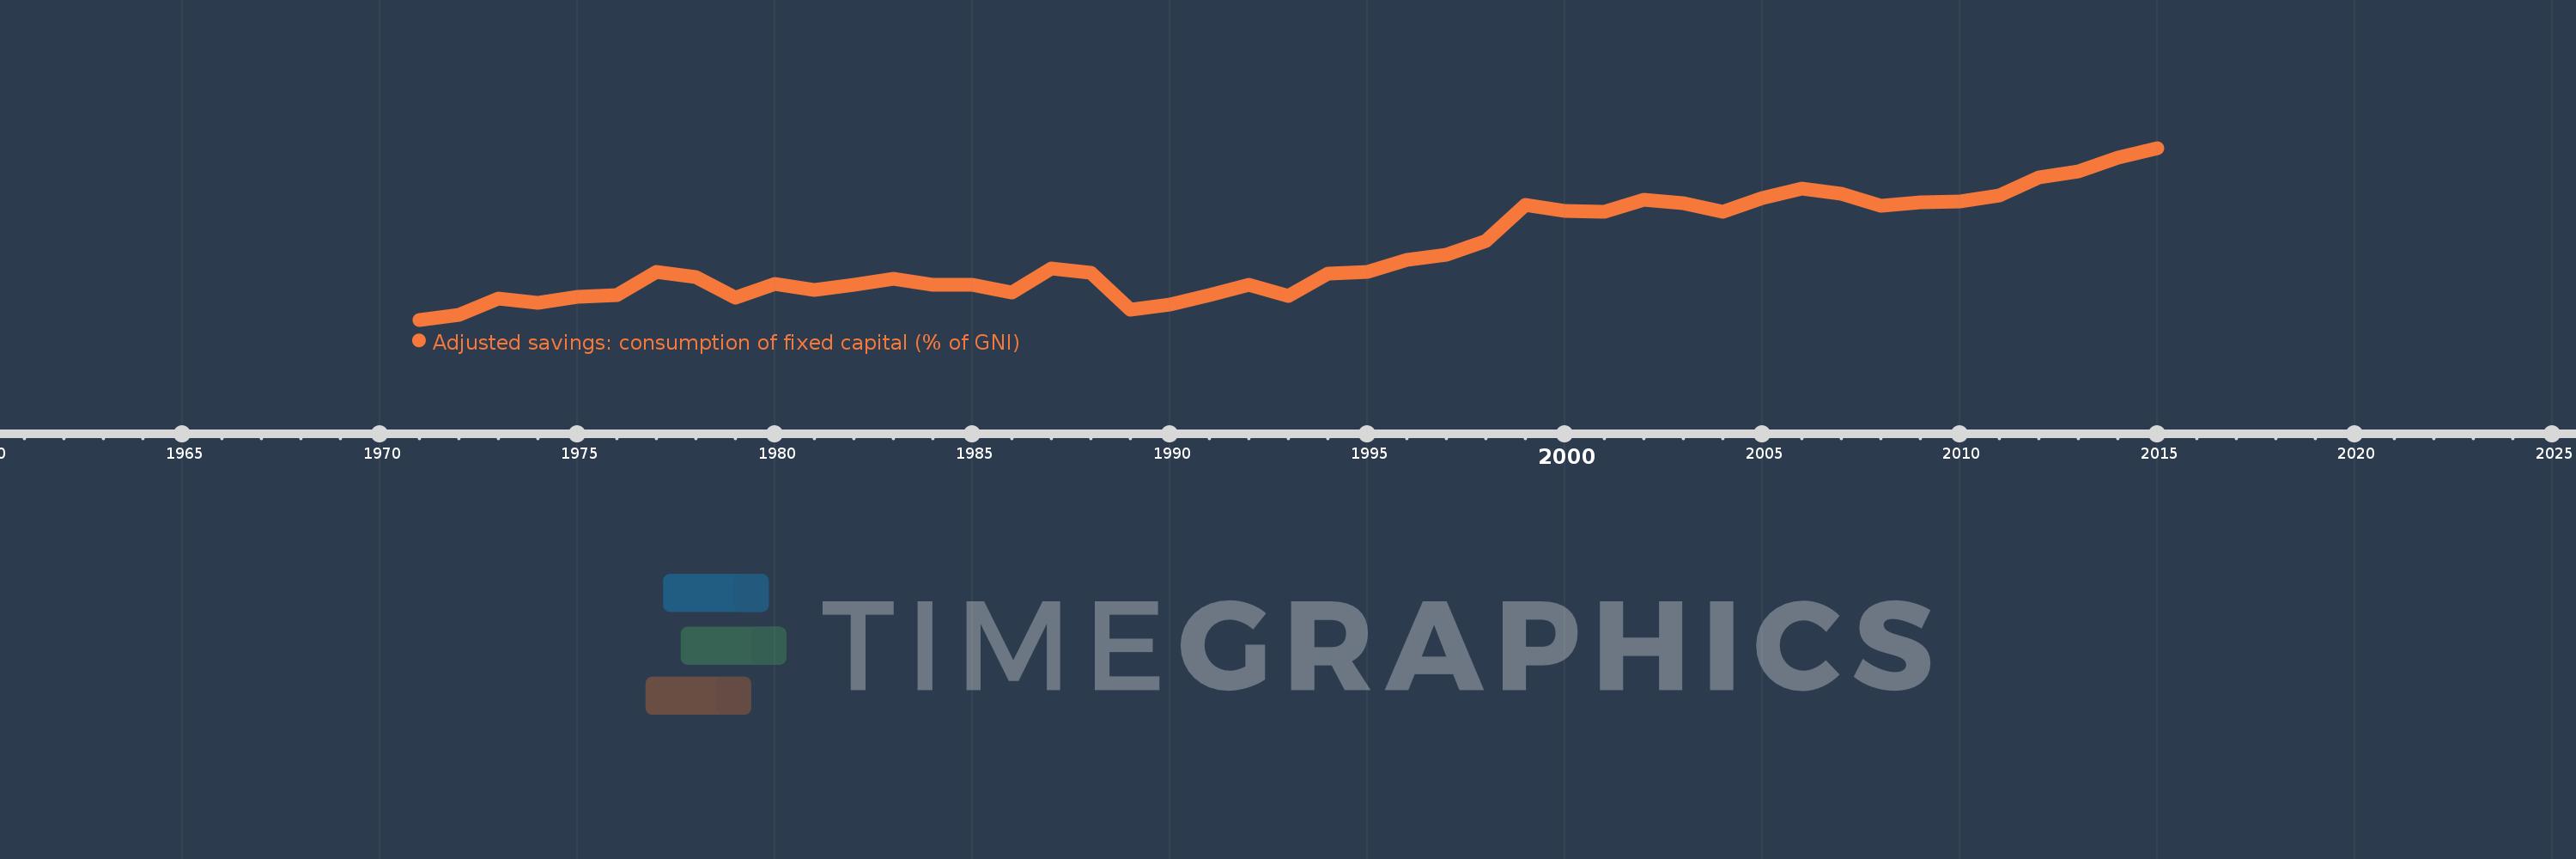
Adjusted savings: consumption of fixed capital (% of GNI)
2015,2014,2013,2012,2011,2010,2009,2008,2007,2006,2005,2004,2003,2002,2001,2000,1999,1998,1997,1996,1995,1994,1993,1992,1991,1990,1989,1988,1987,1986,1985,1984,1983,1982,1981,1980,1979,1978,1977,1976,1975,1974,1973,1972,1971
This statistics in other country:
AfghanistanAlbaniaAlgeriaAndorraAngolaAntigua and BarbudaArab WorldArgentinaArmeniaAustraliaAustriaAzerbaijanBahamas, TheBahrainBangladeshBarbadosBelarusBelgiumBelizeBeninBermudaBhutanBoliviaBosnia and HerzegovinaBotswanaBrazilBrunei DarussalamBulgariaBurkina FasoBurundiCabo VerdeCambodiaCameroonCanadaCaribbean small statesCentral African RepublicCentral Europe and the BalticsChadChileChinaColombiaComorosCongo, Dem. Rep.Congo, Rep.Costa RicaCote d'IvoireCroatiaCubaCyprusCzech RepublicDenmarkDjiboutiDominicaDominican RepublicEarly-demographic dividendEast Asia & PacificEast Asia & Pacific (excluding high income)East Asia & Pacific (IDA & IBRD countries)EcuadorEgypt, Arab Rep.El SalvadorEquatorial GuineaEritreaEstoniaEthiopiaEuro areaEurope & Central AsiaEurope & Central Asia (excluding high income)Europe & Central Asia (IDA & IBRD countries)European UnionFijiFinlandFragile and conflict affected situationsFranceGabonGambia, TheGeorgiaGermanyGhanaGreeceGreenlandGrenadaGuatemalaGuineaGuinea-BissauGuyanaHaitiHeavily indebted poor countries (HIPC)High incomeHondurasHong Kong SAR, ChinaHungaryIBRD onlyIcelandIDA & IBRD totalIDA blendIDA onlyIDA totalIndiaIndonesiaIran, Islamic Rep.IraqIrelandIsraelItalyJamaicaJapanJordanKazakhstanKenyaKiribatiKorea, Rep.KosovoKuwaitKyrgyz RepublicLao PDRLate-demographic dividendLatin America & Caribbean Latin America & Caribbean (excluding high income)Latin America & the Caribbean (IDA & IBRD countries)LatviaLeast developed countries: UN classificationLebanonLesothoLiberiaLibyaLiechtensteinLithuaniaLow & middle incomeLow incomeLower middle incomeLuxembourgMacao SAR, ChinaMacedonia, FYRMadagascarMalawiMalaysiaMaldivesMaliMaltaMarshall IslandsMauritaniaMauritiusMexicoMicronesia, Fed. Sts.Middle East & North AfricaMiddle East & North Africa (excluding high income)Middle East & North Africa (IDA & IBRD countries)Middle incomeMoldovaMonacoMongoliaMontenegroMoroccoMozambiqueMyanmarNamibiaNepalNetherlandsNew ZealandNicaraguaNigerNigeriaNorth AmericaNorwayOECD membersOmanOther small statesPacific island small statesPakistanPalauPanamaPapua New GuineaParaguayPeruPhilippinesPolandPortugalPost-demographic dividendPre-demographic dividendPuerto RicoQatarRomaniaRussian FederationRwandaSamoaSan MarinoSao Tome and PrincipeSaudi ArabiaSenegalSerbiaSeychellesSierra LeoneSingaporeSlovak RepublicSloveniaSmall statesSolomon IslandsSouth AfricaSouth AsiaSouth Asia (IDA & IBRD)SpainSri LankaSt. Kitts and NevisSt. LuciaSt. Vincent and the GrenadinesSub-Saharan Africa Sub-Saharan Africa (excluding high income)Sub-Saharan Africa (IDA & IBRD countries)SudanSurinameSwazilandSwedenSwitzerlandSyrian Arab RepublicTajikistanTanzaniaThailandTimor-LesteTogoTongaTrinidad and TobagoTunisiaTurkeyTurkmenistanTuvaluUgandaUkraineUnited Arab EmiratesUnited KingdomUnited StatesUpper middle incomeUruguayUzbekistanVanuatuVenezuela, RBVietnamWest Bank and GazaWorldYemen, Rep.ZambiaZimbabwe Timeline:
This timeline shows a graph from 1971 to 2015 of East Asia & Pacific (excluding high income). No data until 1970. Number of actual observations by date: 45.
Source name:
World Development Indicators
Source organization:
World Bank staff estimates using data from the United Nations Statistics Division's National Accounts Statistics.
Categories, topics:
Economy & Growth, Environment
Last updated:
apr 23, 2017
Indicators value changes by year
Maximum:
12.531
jan 1, 2015
At the date of observation
Value
Absolute change
Change from previous value
jan 1, 1971
8.694
+8.694
0.0%
jan 1, 1972
8.806
+0.112
1.29%
jan 1, 1973
9.176
+0.37
4.2%
jan 1, 1974
9.072
-0.104
-1.13%
jan 1, 1975
9.208
+0.136
1.5%
jan 1, 1976
9.239
+0.031
0.33%
jan 1, 1977
9.767
+0.528
5.72%
jan 1, 1978
9.655
-0.112
-1.15%
jan 1, 1979
9.184
-0.47
-4.87%
jan 1, 1980
9.497
+0.313
3.41%
jan 1, 1981
9.365
-0.133
-1.4%
jan 1, 1982
9.467
+0.102
1.09%
jan 1, 1983
9.601
+0.135
1.42%
jan 1, 1984
9.471
-0.131
-1.36%
jan 1, 1985
9.466
-0.005
-0.05%
jan 1, 1986
9.3
-0.166
-1.75%
jan 1, 1987
9.835
+0.535
5.75%
jan 1, 1988
9.751
-0.084
-0.86%
jan 1, 1989
8.909
-0.842
-8.63%
jan 1, 1990
9.033
+0.124
1.4%
jan 1, 1991
9.238
+0.205
2.26%
jan 1, 1992
9.479
+0.241
2.61%
jan 1, 1993
9.227
-0.252
-2.66%
jan 1, 1994
9.728
+0.501
5.43%
jan 1, 1995
9.77
+0.042
0.43%
jan 1, 1996
10.026
+0.256
2.62%
jan 1, 1997
10.152
+0.126
1.26%
jan 1, 1998
10.445
+0.294
2.89%
jan 1, 1999
11.268
+0.823
7.88%
jan 1, 2000
11.116
-0.152
-1.35%
jan 1, 2001
11.105
-0.012
-0.1%
jan 1, 2002
11.369
+0.264
2.38%
jan 1, 2003
11.296
-0.073
-0.64%
jan 1, 2004
11.113
-0.183
-1.62%
jan 1, 2005
11.413
+0.3
2.7%
jan 1, 2006
11.626
+0.213
1.87%
jan 1, 2007
11.517
-0.109
-0.94%
jan 1, 2008
11.235
-0.281
-2.44%
jan 1, 2009
11.307
+0.071
0.64%
jan 1, 2010
11.333
+0.027
0.24%
jan 1, 2011
11.468
+0.134
1.19%
jan 1, 2012
11.878
+0.41
3.58%
jan 1, 2013
11.998
+0.121
1.01%
jan 1, 2014
12.313
+0.315
2.62%
jan 1, 2015
12.531
+0.218
1.77%
Ranking of countries by current statistics by years


Comments: