29
/
en
AIzaSyAYiBZKx7MnpbEhh9jyipgxe19OcubqV5w
April 1, 2024
130050
Ethiopia
ETH
true
2
1
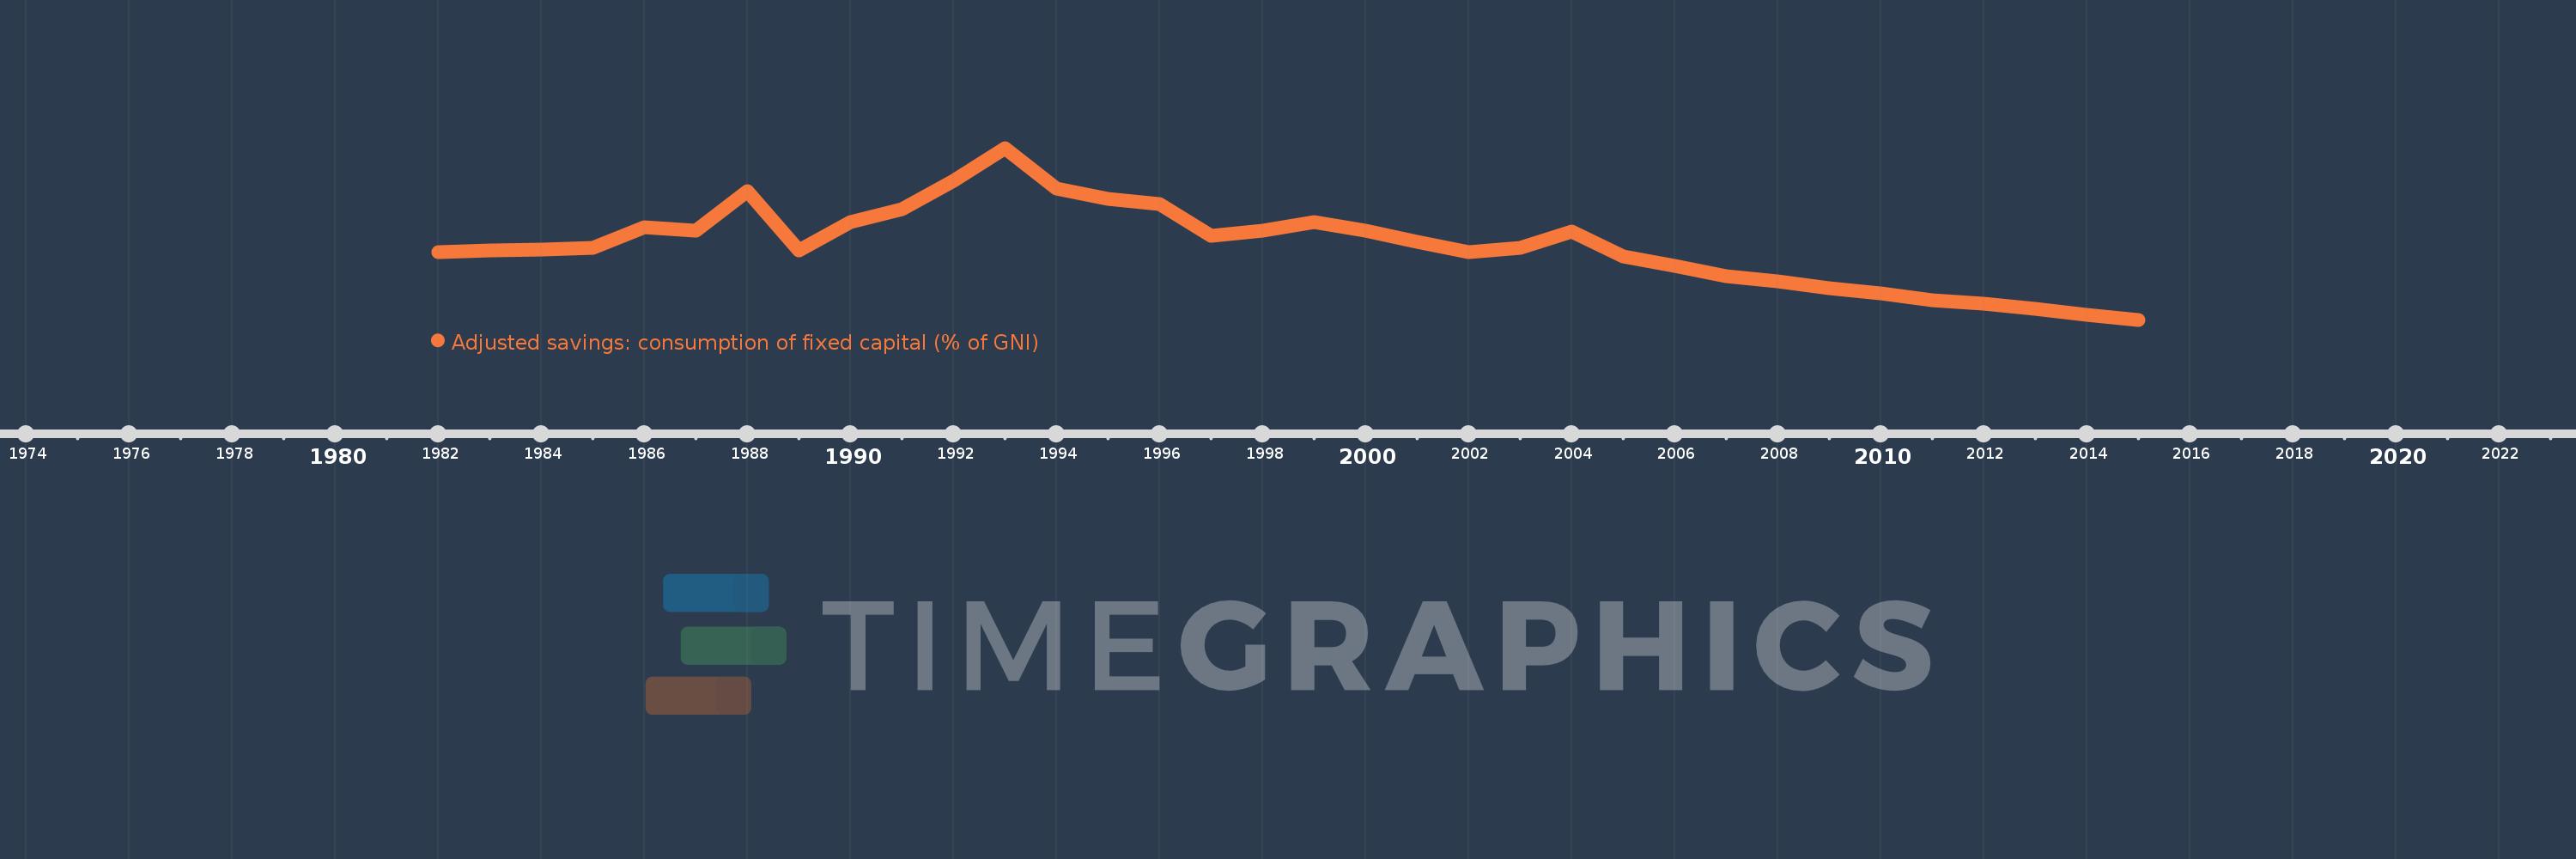
Adjusted savings: consumption of fixed capital (% of GNI)
2015,2014,2013,2012,2011,2010,2009,2008,2007,2006,2005,2004,2003,2002,2001,2000,1999,1998,1997,1996,1995,1994,1993,1992,1991,1990,1989,1988,1987,1986,1985,1984,1983,1982
This statistics in other country:
AfghanistanAlbaniaAlgeriaAndorraAngolaAntigua and BarbudaArab WorldArgentinaArmeniaAustraliaAustriaAzerbaijanBahamas, TheBahrainBangladeshBarbadosBelarusBelgiumBelizeBeninBermudaBhutanBoliviaBosnia and HerzegovinaBotswanaBrazilBrunei DarussalamBulgariaBurkina FasoBurundiCabo VerdeCambodiaCameroonCanadaCaribbean small statesCentral African RepublicCentral Europe and the BalticsChadChileChinaColombiaComorosCongo, Dem. Rep.Congo, Rep.Costa RicaCote d'IvoireCroatiaCubaCyprusCzech RepublicDenmarkDjiboutiDominicaDominican RepublicEarly-demographic dividendEast Asia & PacificEast Asia & Pacific (excluding high income)East Asia & Pacific (IDA & IBRD countries)EcuadorEgypt, Arab Rep.El SalvadorEquatorial GuineaEritreaEstoniaEthiopiaEuro areaEurope & Central AsiaEurope & Central Asia (excluding high income)Europe & Central Asia (IDA & IBRD countries)European UnionFijiFinlandFragile and conflict affected situationsFranceGabonGambia, TheGeorgiaGermanyGhanaGreeceGreenlandGrenadaGuatemalaGuineaGuinea-BissauGuyanaHaitiHeavily indebted poor countries (HIPC)High incomeHondurasHong Kong SAR, ChinaHungaryIBRD onlyIcelandIDA & IBRD totalIDA blendIDA onlyIDA totalIndiaIndonesiaIran, Islamic Rep.IraqIrelandIsraelItalyJamaicaJapanJordanKazakhstanKenyaKiribatiKorea, Rep.KosovoKuwaitKyrgyz RepublicLao PDRLate-demographic dividendLatin America & Caribbean Latin America & Caribbean (excluding high income)Latin America & the Caribbean (IDA & IBRD countries)LatviaLeast developed countries: UN classificationLebanonLesothoLiberiaLibyaLiechtensteinLithuaniaLow & middle incomeLow incomeLower middle incomeLuxembourgMacao SAR, ChinaMacedonia, FYRMadagascarMalawiMalaysiaMaldivesMaliMaltaMarshall IslandsMauritaniaMauritiusMexicoMicronesia, Fed. Sts.Middle East & North AfricaMiddle East & North Africa (excluding high income)Middle East & North Africa (IDA & IBRD countries)Middle incomeMoldovaMonacoMongoliaMontenegroMoroccoMozambiqueMyanmarNamibiaNepalNetherlandsNew ZealandNicaraguaNigerNigeriaNorth AmericaNorwayOECD membersOmanOther small statesPacific island small statesPakistanPalauPanamaPapua New GuineaParaguayPeruPhilippinesPolandPortugalPost-demographic dividendPre-demographic dividendPuerto RicoQatarRomaniaRussian FederationRwandaSamoaSan MarinoSao Tome and PrincipeSaudi ArabiaSenegalSerbiaSeychellesSierra LeoneSingaporeSlovak RepublicSloveniaSmall statesSolomon IslandsSouth AfricaSouth AsiaSouth Asia (IDA & IBRD)SpainSri LankaSt. Kitts and NevisSt. LuciaSt. Vincent and the GrenadinesSub-Saharan Africa Sub-Saharan Africa (excluding high income)Sub-Saharan Africa (IDA & IBRD countries)SudanSurinameSwazilandSwedenSwitzerlandSyrian Arab RepublicTajikistanTanzaniaThailandTimor-LesteTogoTongaTrinidad and TobagoTunisiaTurkeyTurkmenistanTuvaluUgandaUkraineUnited Arab EmiratesUnited KingdomUnited StatesUpper middle incomeUruguayUzbekistanVanuatuVenezuela, RBVietnamWest Bank and GazaWorldYemen, Rep.ZambiaZimbabwe Timeline:
This timeline shows a graph from 1982 to 2015 of Ethiopia. No data until 1981. Number of actual observations by date: 34.
Source name:
World Development Indicators
Source organization:
World Bank staff estimates using data from the United Nations Statistics Division's National Accounts Statistics.
Categories, topics:
Economy & Growth, Environment
Last updated:
apr 23, 2017
Indicators value changes by year
Maximum:
11.895
jan 1, 1993
At the date of observation
Value
Absolute change
Change from previous value
jan 1, 1982
7.939
+7.939
0.0%
jan 1, 1983
8.006
+0.067
0.85%
jan 1, 1984
8.057
+0.051
0.63%
jan 1, 1985
8.121
+0.064
0.79%
jan 1, 1986
8.892
+0.771
9.49%
jan 1, 1987
8.77
-0.122
-1.37%
jan 1, 1988
10.25
+1.48
16.88%
jan 1, 1989
8.006
-2.244
-21.89%
jan 1, 1990
9.08
+1.074
13.41%
jan 1, 1991
9.578
+0.498
5.48%
jan 1, 1992
10.635
+1.058
11.05%
jan 1, 1993
11.895
+1.259
11.84%
jan 1, 1994
10.369
-1.526
-12.83%
jan 1, 1995
9.954
-0.416
-4.01%
jan 1, 1996
9.78
-0.174
-1.75%
jan 1, 1997
8.572
-1.208
-12.35%
jan 1, 1998
8.759
+0.187
2.18%
jan 1, 1999
9.094
+0.335
3.83%
jan 1, 2000
8.766
-0.328
-3.61%
jan 1, 2001
8.328
-0.438
-5.0%
jan 1, 2002
7.941
-0.387
-4.65%
jan 1, 2003
8.128
+0.187
2.36%
jan 1, 2004
8.729
+0.601
7.39%
jan 1, 2005
7.804
-0.924
-10.59%
jan 1, 2006
7.421
-0.383
-4.91%
jan 1, 2007
7.049
-0.372
-5.02%
jan 1, 2008
6.856
-0.192
-2.73%
jan 1, 2009
6.576
-0.28
-4.09%
jan 1, 2010
6.387
-0.189
-2.87%
jan 1, 2011
6.132
-0.255
-3.99%
jan 1, 2012
5.992
-0.14
-2.28%
jan 1, 2013
5.792
-0.201
-3.35%
jan 1, 2014
5.591
-0.201
-3.47%
jan 1, 2015
5.393
-0.198
-3.54%
Ranking of countries by current statistics by years


Comments: