29
/
en
AIzaSyAYiBZKx7MnpbEhh9jyipgxe19OcubqV5w
April 1, 2024
108207
Comoros
COM
true
2
1
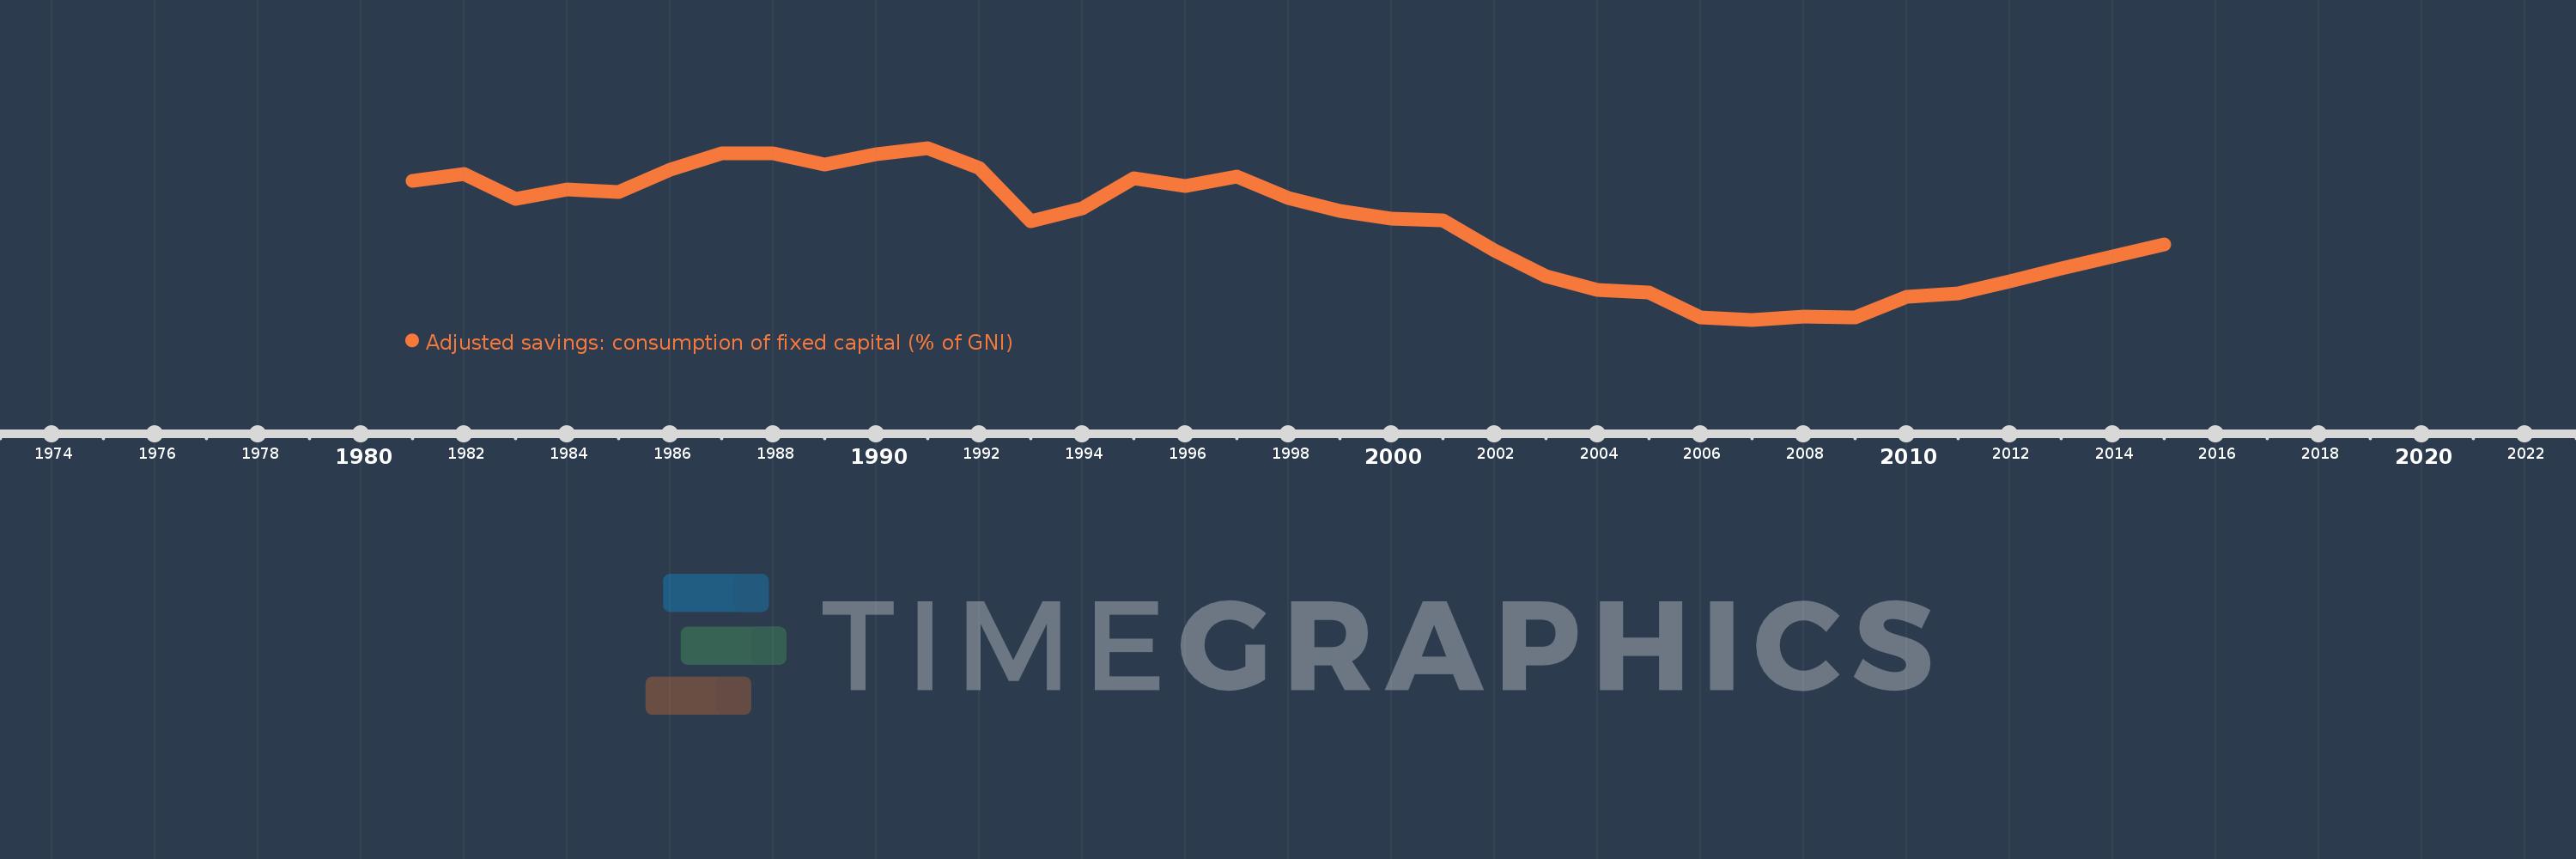
Adjusted savings: consumption of fixed capital (% of GNI)
2015,2014,2013,2012,2011,2010,2009,2008,2007,2006,2005,2004,2003,2002,2001,2000,1999,1998,1997,1996,1995,1994,1993,1992,1991,1990,1989,1988,1987,1986,1985,1984,1983,1982,1981
This statistics in other country:
AfghanistanAlbaniaAlgeriaAndorraAngolaAntigua and BarbudaArab WorldArgentinaArmeniaAustraliaAustriaAzerbaijanBahamas, TheBahrainBangladeshBarbadosBelarusBelgiumBelizeBeninBermudaBhutanBoliviaBosnia and HerzegovinaBotswanaBrazilBrunei DarussalamBulgariaBurkina FasoBurundiCabo VerdeCambodiaCameroonCanadaCaribbean small statesCentral African RepublicCentral Europe and the BalticsChadChileChinaColombiaComorosCongo, Dem. Rep.Congo, Rep.Costa RicaCote d'IvoireCroatiaCubaCyprusCzech RepublicDenmarkDjiboutiDominicaDominican RepublicEarly-demographic dividendEast Asia & PacificEast Asia & Pacific (excluding high income)East Asia & Pacific (IDA & IBRD countries)EcuadorEgypt, Arab Rep.El SalvadorEquatorial GuineaEritreaEstoniaEthiopiaEuro areaEurope & Central AsiaEurope & Central Asia (excluding high income)Europe & Central Asia (IDA & IBRD countries)European UnionFijiFinlandFragile and conflict affected situationsFranceGabonGambia, TheGeorgiaGermanyGhanaGreeceGreenlandGrenadaGuatemalaGuineaGuinea-BissauGuyanaHaitiHeavily indebted poor countries (HIPC)High incomeHondurasHong Kong SAR, ChinaHungaryIBRD onlyIcelandIDA & IBRD totalIDA blendIDA onlyIDA totalIndiaIndonesiaIran, Islamic Rep.IraqIrelandIsraelItalyJamaicaJapanJordanKazakhstanKenyaKiribatiKorea, Rep.KosovoKuwaitKyrgyz RepublicLao PDRLate-demographic dividendLatin America & Caribbean Latin America & Caribbean (excluding high income)Latin America & the Caribbean (IDA & IBRD countries)LatviaLeast developed countries: UN classificationLebanonLesothoLiberiaLibyaLiechtensteinLithuaniaLow & middle incomeLow incomeLower middle incomeLuxembourgMacao SAR, ChinaMacedonia, FYRMadagascarMalawiMalaysiaMaldivesMaliMaltaMarshall IslandsMauritaniaMauritiusMexicoMicronesia, Fed. Sts.Middle East & North AfricaMiddle East & North Africa (excluding high income)Middle East & North Africa (IDA & IBRD countries)Middle incomeMoldovaMonacoMongoliaMontenegroMoroccoMozambiqueMyanmarNamibiaNepalNetherlandsNew ZealandNicaraguaNigerNigeriaNorth AmericaNorwayOECD membersOmanOther small statesPacific island small statesPakistanPalauPanamaPapua New GuineaParaguayPeruPhilippinesPolandPortugalPost-demographic dividendPre-demographic dividendPuerto RicoQatarRomaniaRussian FederationRwandaSamoaSan MarinoSao Tome and PrincipeSaudi ArabiaSenegalSerbiaSeychellesSierra LeoneSingaporeSlovak RepublicSloveniaSmall statesSolomon IslandsSouth AfricaSouth AsiaSouth Asia (IDA & IBRD)SpainSri LankaSt. Kitts and NevisSt. LuciaSt. Vincent and the GrenadinesSub-Saharan Africa Sub-Saharan Africa (excluding high income)Sub-Saharan Africa (IDA & IBRD countries)SudanSurinameSwazilandSwedenSwitzerlandSyrian Arab RepublicTajikistanTanzaniaThailandTimor-LesteTogoTongaTrinidad and TobagoTunisiaTurkeyTurkmenistanTuvaluUgandaUkraineUnited Arab EmiratesUnited KingdomUnited StatesUpper middle incomeUruguayUzbekistanVanuatuVenezuela, RBVietnamWest Bank and GazaWorldYemen, Rep.ZambiaZimbabwe Timeline:
This timeline shows a graph from 1981 to 2015 of Comoros. No data until 1980. Number of actual observations by date: 35.
Source name:
World Development Indicators
Source organization:
World Bank staff estimates using data from the United Nations Statistics Division's National Accounts Statistics.
Categories, topics:
Economy & Growth, Environment
Last updated:
apr 23, 2017
Indicators value changes by year
Minimum:
10.796
jan 1, 2007
Maximum:
14.893
jan 1, 1991
At the date of observation
Value
Absolute change
Change from previous value
jan 1, 1981
14.108
+14.108
0.0%
jan 1, 1982
14.27
+0.163
1.15%
jan 1, 1983
13.677
-0.593
-4.16%
jan 1, 1984
13.899
+0.222
1.62%
jan 1, 1985
13.846
-0.052
-0.38%
jan 1, 1986
14.38
+0.534
3.86%
jan 1, 1987
14.774
+0.394
2.74%
jan 1, 1988
14.762
-0.012
-0.08%
jan 1, 1989
14.506
-0.257
-1.74%
jan 1, 1990
14.744
+0.239
1.64%
jan 1, 1991
14.893
+0.149
1.01%
jan 1, 1992
14.424
-0.469
-3.15%
jan 1, 1993
13.146
-1.279
-8.86%
jan 1, 1994
13.446
+0.301
2.29%
jan 1, 1995
14.174
+0.728
5.41%
jan 1, 1996
13.982
-0.193
-1.36%
jan 1, 1997
14.219
+0.237
1.7%
jan 1, 1998
13.689
-0.53
-3.73%
jan 1, 1999
13.386
-0.302
-2.21%
jan 1, 2000
13.216
-0.171
-1.28%
jan 1, 2001
13.158
-0.058
-0.44%
jan 1, 2002
12.449
-0.709
-5.39%
jan 1, 2003
11.831
-0.618
-4.96%
jan 1, 2004
11.513
-0.318
-2.69%
jan 1, 2005
11.449
-0.064
-0.56%
jan 1, 2006
10.843
-0.606
-5.3%
jan 1, 2007
10.796
-0.047
-0.43%
jan 1, 2008
10.862
+0.066
0.61%
jan 1, 2009
10.844
-0.018
-0.16%
jan 1, 2010
11.352
+0.508
4.68%
jan 1, 2011
11.431
+0.079
0.7%
jan 1, 2012
11.72
+0.289
2.52%
jan 1, 2013
12.012
+0.292
2.49%
jan 1, 2014
12.303
+0.292
2.43%
jan 1, 2015
12.595
+0.292
2.37%
Ranking of countries by current statistics by years


Comments: