29
/
en
AIzaSyAYiBZKx7MnpbEhh9jyipgxe19OcubqV5w
April 1, 2024
256013
Sweden
SWE
true
2
1
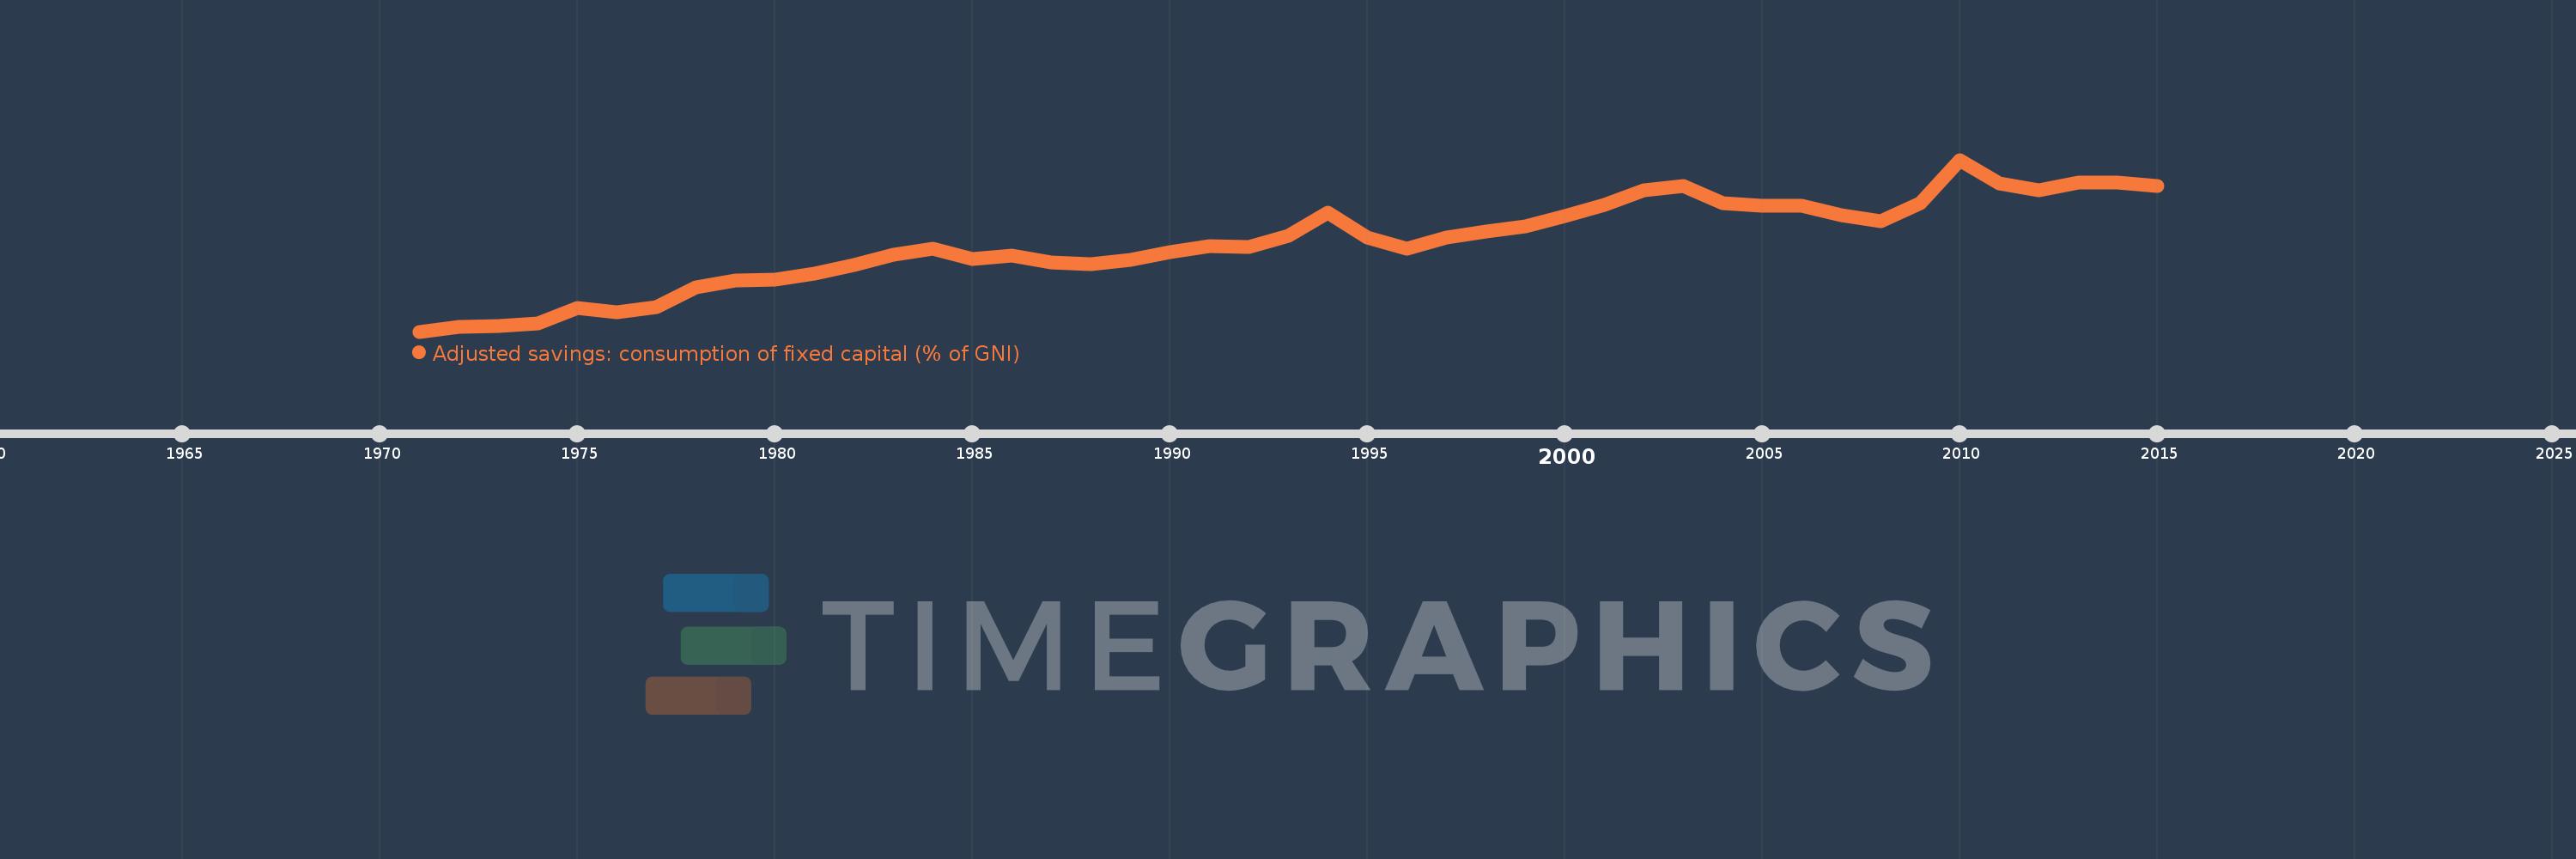
Adjusted savings: consumption of fixed capital (% of GNI)
2015,2014,2013,2012,2011,2010,2009,2008,2007,2006,2005,2004,2003,2002,2001,2000,1999,1998,1997,1996,1995,1994,1993,1992,1991,1990,1989,1988,1987,1986,1985,1984,1983,1982,1981,1980,1979,1978,1977,1976,1975,1974,1973,1972,1971
This statistics in other country:
AfghanistanAlbaniaAlgeriaAndorraAngolaAntigua and BarbudaArab WorldArgentinaArmeniaAustraliaAustriaAzerbaijanBahamas, TheBahrainBangladeshBarbadosBelarusBelgiumBelizeBeninBermudaBhutanBoliviaBosnia and HerzegovinaBotswanaBrazilBrunei DarussalamBulgariaBurkina FasoBurundiCabo VerdeCambodiaCameroonCanadaCaribbean small statesCentral African RepublicCentral Europe and the BalticsChadChileChinaColombiaComorosCongo, Dem. Rep.Congo, Rep.Costa RicaCote d'IvoireCroatiaCubaCyprusCzech RepublicDenmarkDjiboutiDominicaDominican RepublicEarly-demographic dividendEast Asia & PacificEast Asia & Pacific (excluding high income)East Asia & Pacific (IDA & IBRD countries)EcuadorEgypt, Arab Rep.El SalvadorEquatorial GuineaEritreaEstoniaEthiopiaEuro areaEurope & Central AsiaEurope & Central Asia (excluding high income)Europe & Central Asia (IDA & IBRD countries)European UnionFijiFinlandFragile and conflict affected situationsFranceGabonGambia, TheGeorgiaGermanyGhanaGreeceGreenlandGrenadaGuatemalaGuineaGuinea-BissauGuyanaHaitiHeavily indebted poor countries (HIPC)High incomeHondurasHong Kong SAR, ChinaHungaryIBRD onlyIcelandIDA & IBRD totalIDA blendIDA onlyIDA totalIndiaIndonesiaIran, Islamic Rep.IraqIrelandIsraelItalyJamaicaJapanJordanKazakhstanKenyaKiribatiKorea, Rep.KosovoKuwaitKyrgyz RepublicLao PDRLate-demographic dividendLatin America & Caribbean Latin America & Caribbean (excluding high income)Latin America & the Caribbean (IDA & IBRD countries)LatviaLeast developed countries: UN classificationLebanonLesothoLiberiaLibyaLiechtensteinLithuaniaLow & middle incomeLow incomeLower middle incomeLuxembourgMacao SAR, ChinaMacedonia, FYRMadagascarMalawiMalaysiaMaldivesMaliMaltaMarshall IslandsMauritaniaMauritiusMexicoMicronesia, Fed. Sts.Middle East & North AfricaMiddle East & North Africa (excluding high income)Middle East & North Africa (IDA & IBRD countries)Middle incomeMoldovaMonacoMongoliaMontenegroMoroccoMozambiqueMyanmarNamibiaNepalNetherlandsNew ZealandNicaraguaNigerNigeriaNorth AmericaNorwayOECD membersOmanOther small statesPacific island small statesPakistanPalauPanamaPapua New GuineaParaguayPeruPhilippinesPolandPortugalPost-demographic dividendPre-demographic dividendPuerto RicoQatarRomaniaRussian FederationRwandaSamoaSan MarinoSao Tome and PrincipeSaudi ArabiaSenegalSerbiaSeychellesSierra LeoneSingaporeSlovak RepublicSloveniaSmall statesSolomon IslandsSouth AfricaSouth AsiaSouth Asia (IDA & IBRD)SpainSri LankaSt. Kitts and NevisSt. LuciaSt. Vincent and the GrenadinesSub-Saharan Africa Sub-Saharan Africa (excluding high income)Sub-Saharan Africa (IDA & IBRD countries)SudanSurinameSwazilandSwedenSwitzerlandSyrian Arab RepublicTajikistanTanzaniaThailandTimor-LesteTogoTongaTrinidad and TobagoTunisiaTurkeyTurkmenistanTuvaluUgandaUkraineUnited Arab EmiratesUnited KingdomUnited StatesUpper middle incomeUruguayUzbekistanVanuatuVenezuela, RBVietnamWest Bank and GazaWorldYemen, Rep.ZambiaZimbabwe Timeline:
This timeline shows a graph from 1971 to 2015 of Sweden. No data until 1970. Number of actual observations by date: 45.
Source name:
World Development Indicators
Source organization:
World Bank staff estimates using data from the United Nations Statistics Division's National Accounts Statistics.
Categories, topics:
Economy & Growth, Environment
Last updated:
apr 23, 2017
Indicators value changes by year
Minimum:
10.711
jan 1, 1971
Maximum:
17.118
jan 1, 2010
At the date of observation
Value
Absolute change
Change from previous value
jan 1, 1971
10.711
+10.711
0.0%
jan 1, 1972
10.877
+0.167
1.56%
jan 1, 1973
10.929
+0.052
0.48%
jan 1, 1974
11.007
+0.078
0.71%
jan 1, 1975
11.607
+0.6
5.45%
jan 1, 1976
11.419
-0.188
-1.62%
jan 1, 1977
11.639
+0.22
1.93%
jan 1, 1978
12.372
+0.733
6.29%
jan 1, 1979
12.61
+0.238
1.92%
jan 1, 1980
12.652
+0.042
0.34%
jan 1, 1981
12.86
+0.207
1.64%
jan 1, 1982
13.203
+0.344
2.67%
jan 1, 1983
13.584
+0.38
2.88%
jan 1, 1984
13.799
+0.215
1.59%
jan 1, 1985
13.42
-0.379
-2.74%
jan 1, 1986
13.547
+0.127
0.95%
jan 1, 1987
13.283
-0.264
-1.95%
jan 1, 1988
13.237
-0.046
-0.35%
jan 1, 1989
13.386
+0.149
1.12%
jan 1, 1990
13.678
+0.292
2.18%
jan 1, 1991
13.89
+0.211
1.55%
jan 1, 1992
13.879
-0.011
-0.08%
jan 1, 1993
14.286
+0.408
2.94%
jan 1, 1994
15.145
+0.858
6.01%
jan 1, 1995
14.228
-0.916
-6.05%
jan 1, 1996
13.81
-0.418
-2.94%
jan 1, 1997
14.205
+0.395
2.86%
jan 1, 1998
14.441
+0.236
1.66%
jan 1, 1999
14.642
+0.2
1.39%
jan 1, 2000
15.019
+0.377
2.58%
jan 1, 2001
15.421
+0.402
2.68%
jan 1, 2002
15.98
+0.559
3.62%
jan 1, 2003
16.152
+0.172
1.08%
jan 1, 2004
15.512
-0.64
-3.96%
jan 1, 2005
15.404
-0.108
-0.7%
jan 1, 2006
15.408
+0.004
0.03%
jan 1, 2007
15.058
-0.35
-2.27%
jan 1, 2008
14.841
-0.218
-1.45%
jan 1, 2009
15.487
+0.646
4.35%
jan 1, 2010
17.118
+1.631
10.53%
jan 1, 2011
16.229
-0.889
-5.19%
jan 1, 2012
15.969
-0.26
-1.6%
jan 1, 2013
16.271
+0.302
1.89%
jan 1, 2014
16.259
-0.012
-0.07%
jan 1, 2015
16.144
-0.115
-0.71%
Ranking of countries by current statistics by years


Comments: