29
/
en
AIzaSyAYiBZKx7MnpbEhh9jyipgxe19OcubqV5w
April 1, 2024
171399
Kuwait
KWT
true
2
1
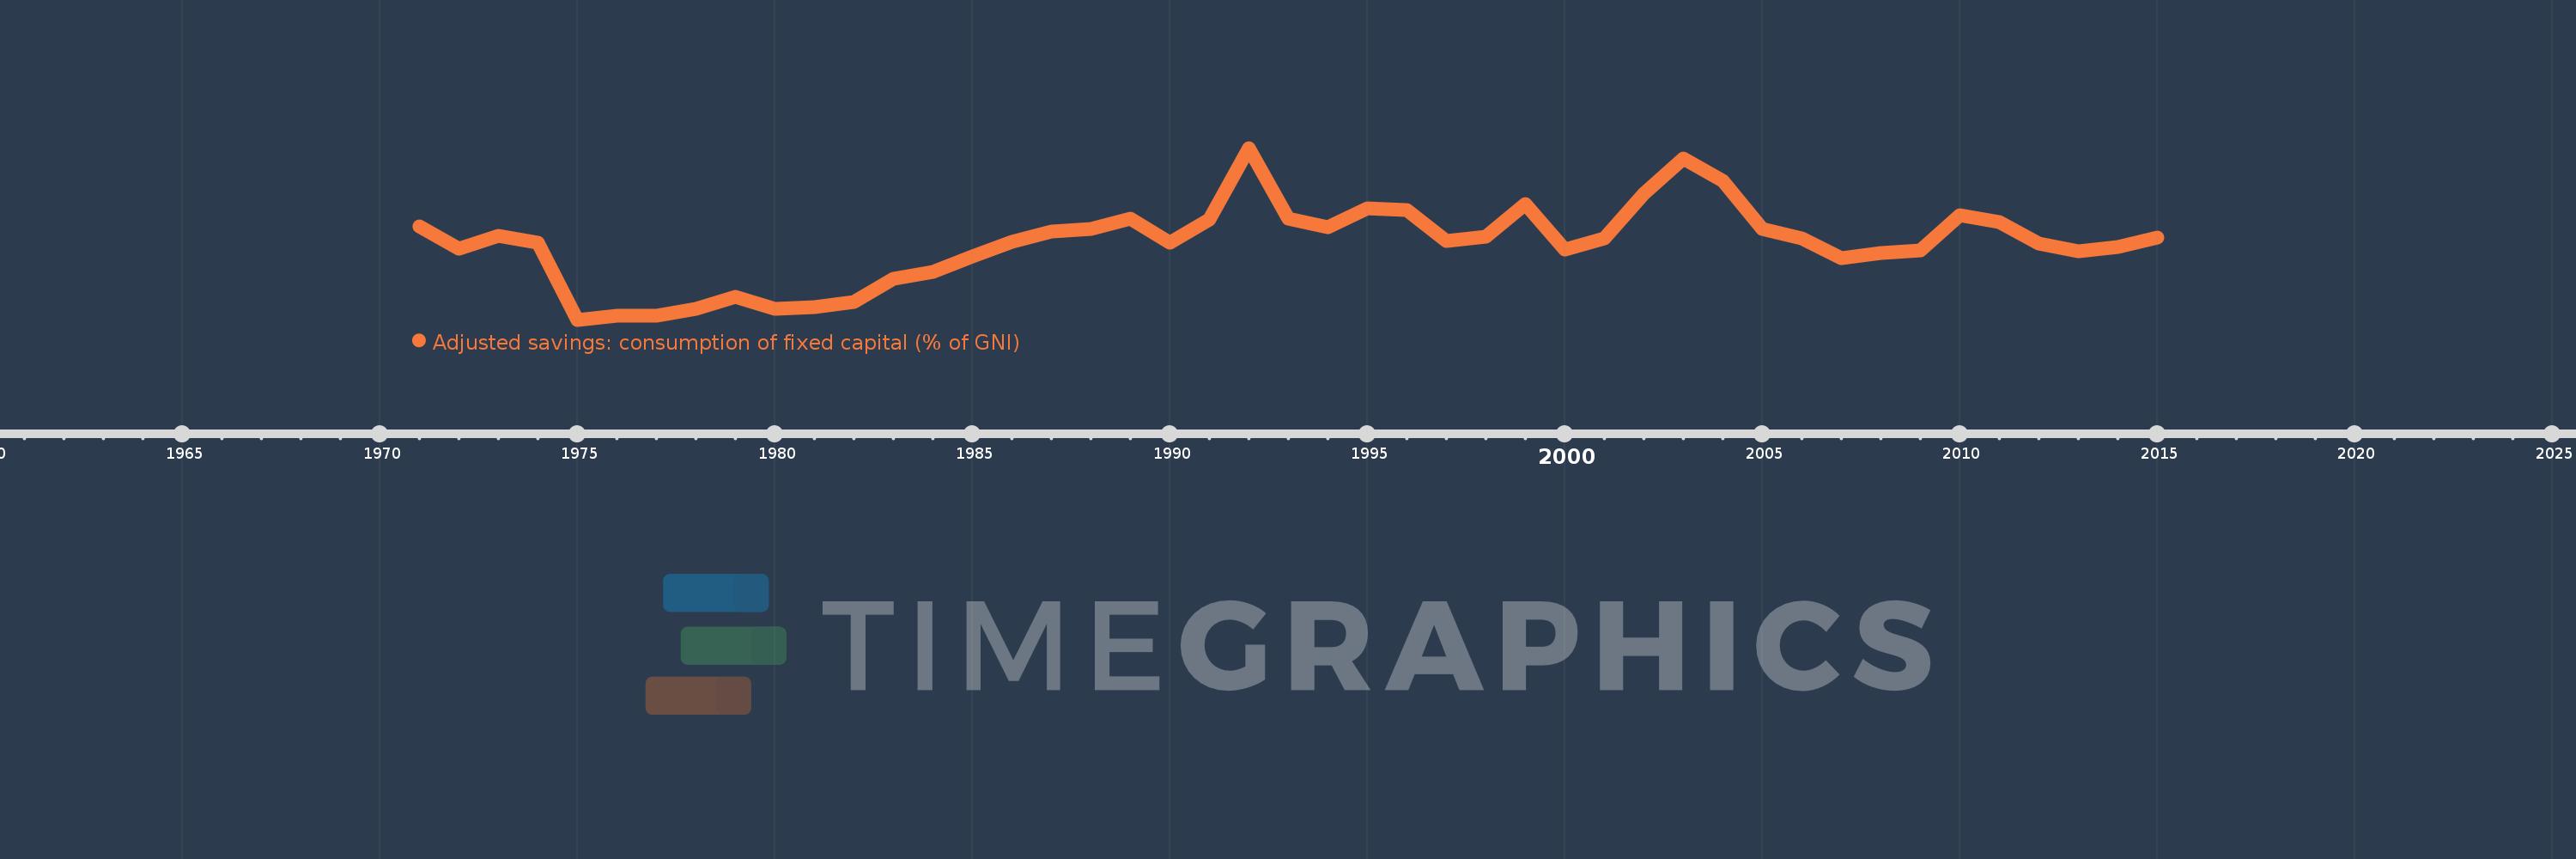
Adjusted savings: consumption of fixed capital (% of GNI)
2015,2014,2013,2012,2011,2010,2009,2008,2007,2006,2005,2004,2003,2002,2001,2000,1999,1998,1997,1996,1995,1994,1993,1992,1991,1990,1989,1988,1987,1986,1985,1984,1983,1982,1981,1980,1979,1978,1977,1976,1975,1974,1973,1972,1971
This statistics in other country:
AfghanistanAlbaniaAlgeriaAndorraAngolaAntigua and BarbudaArab WorldArgentinaArmeniaAustraliaAustriaAzerbaijanBahamas, TheBahrainBangladeshBarbadosBelarusBelgiumBelizeBeninBermudaBhutanBoliviaBosnia and HerzegovinaBotswanaBrazilBrunei DarussalamBulgariaBurkina FasoBurundiCabo VerdeCambodiaCameroonCanadaCaribbean small statesCentral African RepublicCentral Europe and the BalticsChadChileChinaColombiaComorosCongo, Dem. Rep.Congo, Rep.Costa RicaCote d'IvoireCroatiaCubaCyprusCzech RepublicDenmarkDjiboutiDominicaDominican RepublicEarly-demographic dividendEast Asia & PacificEast Asia & Pacific (excluding high income)East Asia & Pacific (IDA & IBRD countries)EcuadorEgypt, Arab Rep.El SalvadorEquatorial GuineaEritreaEstoniaEthiopiaEuro areaEurope & Central AsiaEurope & Central Asia (excluding high income)Europe & Central Asia (IDA & IBRD countries)European UnionFijiFinlandFragile and conflict affected situationsFranceGabonGambia, TheGeorgiaGermanyGhanaGreeceGreenlandGrenadaGuatemalaGuineaGuinea-BissauGuyanaHaitiHeavily indebted poor countries (HIPC)High incomeHondurasHong Kong SAR, ChinaHungaryIBRD onlyIcelandIDA & IBRD totalIDA blendIDA onlyIDA totalIndiaIndonesiaIran, Islamic Rep.IraqIrelandIsraelItalyJamaicaJapanJordanKazakhstanKenyaKiribatiKorea, Rep.KosovoKuwaitKyrgyz RepublicLao PDRLate-demographic dividendLatin America & Caribbean Latin America & Caribbean (excluding high income)Latin America & the Caribbean (IDA & IBRD countries)LatviaLeast developed countries: UN classificationLebanonLesothoLiberiaLibyaLiechtensteinLithuaniaLow & middle incomeLow incomeLower middle incomeLuxembourgMacao SAR, ChinaMacedonia, FYRMadagascarMalawiMalaysiaMaldivesMaliMaltaMarshall IslandsMauritaniaMauritiusMexicoMicronesia, Fed. Sts.Middle East & North AfricaMiddle East & North Africa (excluding high income)Middle East & North Africa (IDA & IBRD countries)Middle incomeMoldovaMonacoMongoliaMontenegroMoroccoMozambiqueMyanmarNamibiaNepalNetherlandsNew ZealandNicaraguaNigerNigeriaNorth AmericaNorwayOECD membersOmanOther small statesPacific island small statesPakistanPalauPanamaPapua New GuineaParaguayPeruPhilippinesPolandPortugalPost-demographic dividendPre-demographic dividendPuerto RicoQatarRomaniaRussian FederationRwandaSamoaSan MarinoSao Tome and PrincipeSaudi ArabiaSenegalSerbiaSeychellesSierra LeoneSingaporeSlovak RepublicSloveniaSmall statesSolomon IslandsSouth AfricaSouth AsiaSouth Asia (IDA & IBRD)SpainSri LankaSt. Kitts and NevisSt. LuciaSt. Vincent and the GrenadinesSub-Saharan Africa Sub-Saharan Africa (excluding high income)Sub-Saharan Africa (IDA & IBRD countries)SudanSurinameSwazilandSwedenSwitzerlandSyrian Arab RepublicTajikistanTanzaniaThailandTimor-LesteTogoTongaTrinidad and TobagoTunisiaTurkeyTurkmenistanTuvaluUgandaUkraineUnited Arab EmiratesUnited KingdomUnited StatesUpper middle incomeUruguayUzbekistanVanuatuVenezuela, RBVietnamWest Bank and GazaWorldYemen, Rep.ZambiaZimbabwe Timeline:
This timeline shows a graph from 1971 to 2015 of Kuwait. No data until 1970. Number of actual observations by date: 45.
Source name:
World Development Indicators
Source organization:
World Bank staff estimates using data from the United Nations Statistics Division's National Accounts Statistics.
Categories, topics:
Economy & Growth, Environment
Last updated:
apr 23, 2017
Indicators value changes by year
Maximum:
10.641
jan 1, 1992
At the date of observation
Value
Absolute change
Change from previous value
jan 1, 1971
6.815
+6.815
0.0%
jan 1, 1972
5.735
-1.08
-15.85%
jan 1, 1973
6.354
+0.619
10.8%
jan 1, 1974
6.026
-0.328
-5.17%
jan 1, 1975
2.294
-3.732
-61.93%
jan 1, 1976
2.508
+0.214
9.31%
jan 1, 1977
2.502
-0.005
-0.22%
jan 1, 1978
2.83
+0.328
13.11%
jan 1, 1979
3.393
+0.563
19.89%
jan 1, 1980
2.813
-0.58
-17.08%
jan 1, 1981
2.9
+0.087
3.09%
jan 1, 1982
3.155
+0.254
8.77%
jan 1, 1983
4.291
+1.136
36.02%
jan 1, 1984
4.601
+0.31
7.22%
jan 1, 1985
5.37
+0.769
16.72%
jan 1, 1986
6.073
+0.703
13.08%
jan 1, 1987
6.581
+0.508
8.36%
jan 1, 1988
6.708
+0.127
1.93%
jan 1, 1989
7.199
+0.491
7.31%
jan 1, 1990
6.03
-1.169
-16.24%
jan 1, 1991
7.168
+1.138
18.88%
jan 1, 1992
10.641
+3.473
48.45%
jan 1, 1993
7.224
-3.416
-32.1%
jan 1, 1994
6.808
-0.416
-5.76%
jan 1, 1995
7.691
+0.883
12.97%
jan 1, 1996
7.606
-0.086
-1.11%
jan 1, 1997
6.111
-1.495
-19.65%
jan 1, 1998
6.309
+0.197
3.23%
jan 1, 1999
7.922
+1.613
25.57%
jan 1, 2000
5.724
-2.197
-27.74%
jan 1, 2001
6.246
+0.521
9.11%
jan 1, 2002
8.416
+2.17
34.75%
jan 1, 2003
10.127
+1.711
20.33%
jan 1, 2004
9.038
-1.089
-10.75%
jan 1, 2005
6.7
-2.338
-25.87%
jan 1, 2006
6.232
-0.468
-6.98%
jan 1, 2007
5.286
-0.946
-15.18%
jan 1, 2008
5.545
+0.259
4.9%
jan 1, 2009
5.646
+0.101
1.82%
jan 1, 2010
7.356
+1.71
30.29%
jan 1, 2011
7.056
-0.3
-4.07%
jan 1, 2012
5.99
-1.067
-15.12%
jan 1, 2013
5.639
-0.35
-5.85%
jan 1, 2014
5.83
+0.19
3.37%
jan 1, 2015
6.292
+0.462
7.93%
Ranking of countries by current statistics by years


Comments: