29
/
en
AIzaSyAYiBZKx7MnpbEhh9jyipgxe19OcubqV5w
April 1, 2024
159107
Ireland
IRL
true
2
1
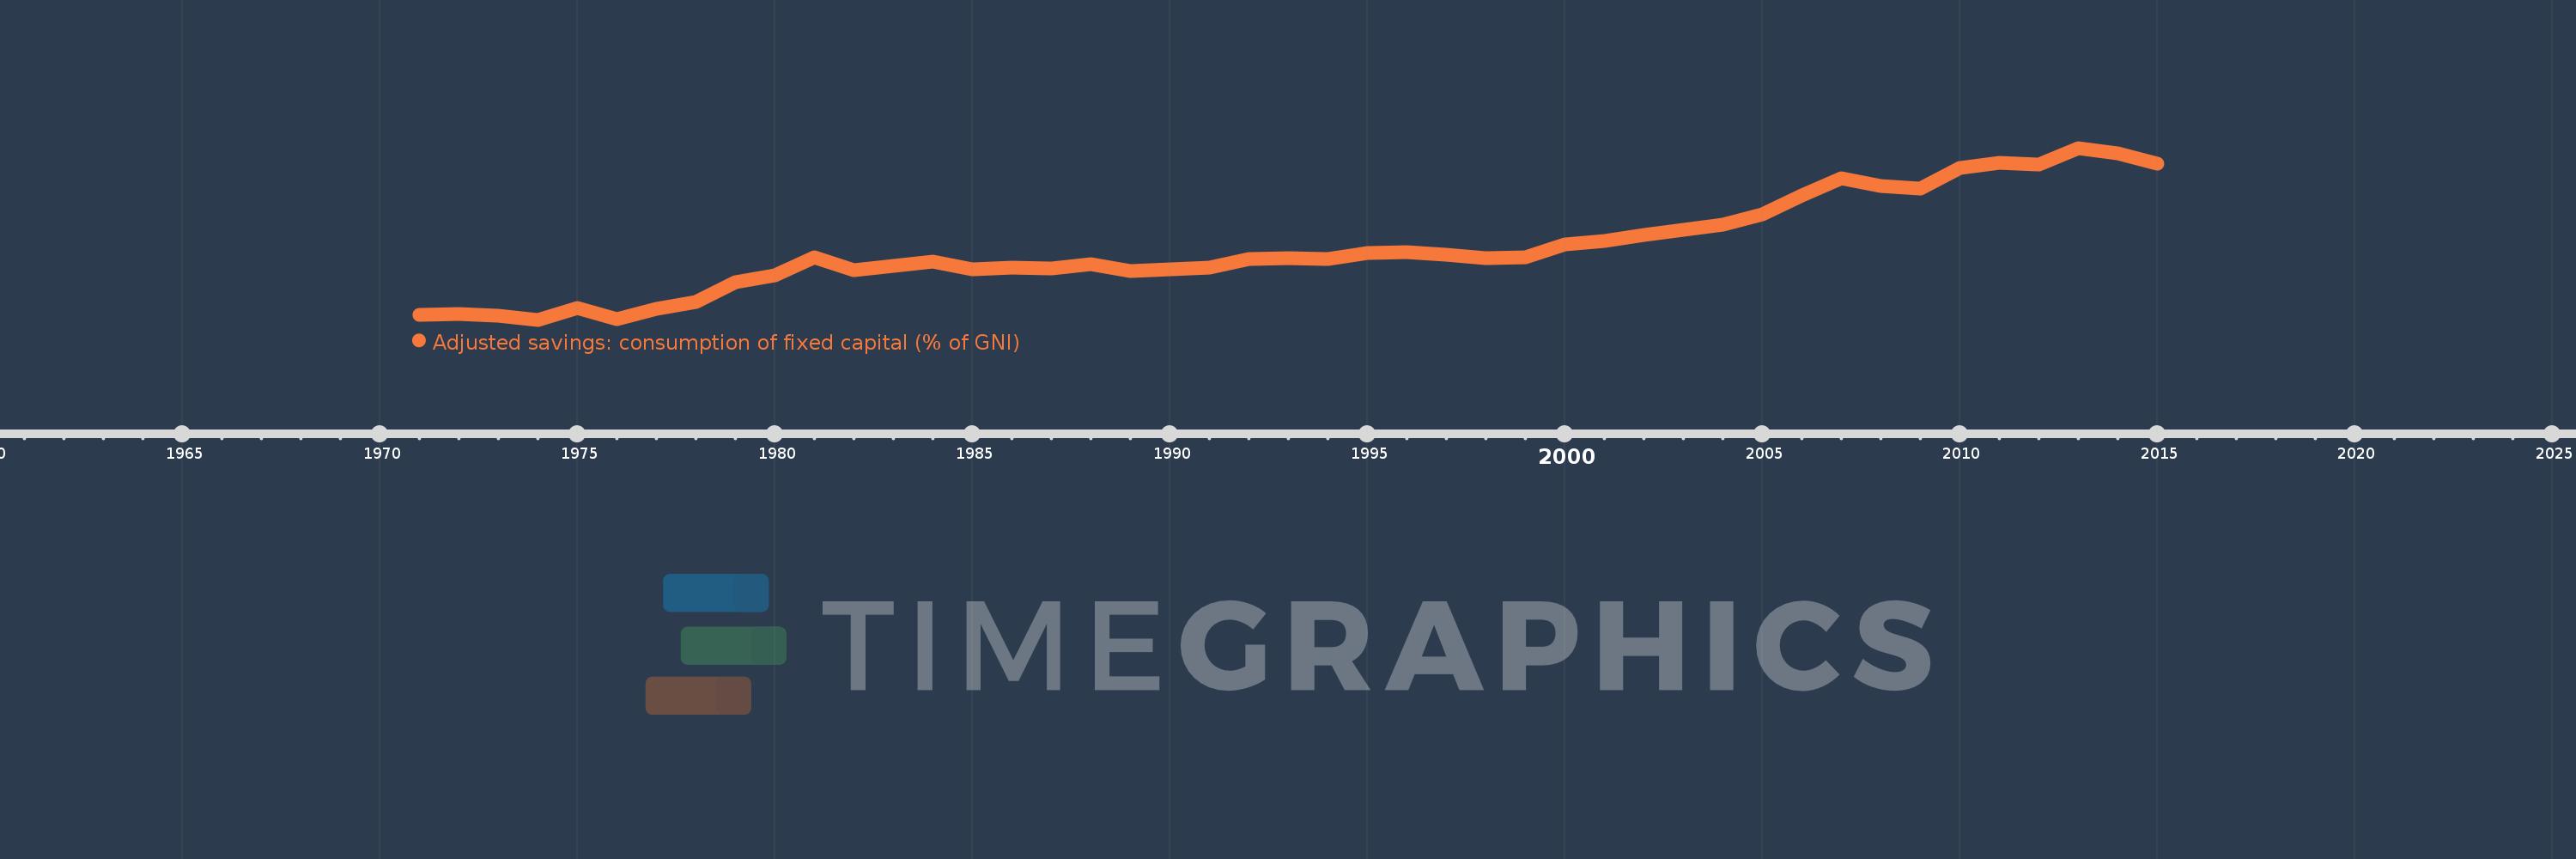
Adjusted savings: consumption of fixed capital (% of GNI)
2015,2014,2013,2012,2011,2010,2009,2008,2007,2006,2005,2004,2003,2002,2001,2000,1999,1998,1997,1996,1995,1994,1993,1992,1991,1990,1989,1988,1987,1986,1985,1984,1983,1982,1981,1980,1979,1978,1977,1976,1975,1974,1973,1972,1971
This statistics in other country:
AfghanistanAlbaniaAlgeriaAndorraAngolaAntigua and BarbudaArab WorldArgentinaArmeniaAustraliaAustriaAzerbaijanBahamas, TheBahrainBangladeshBarbadosBelarusBelgiumBelizeBeninBermudaBhutanBoliviaBosnia and HerzegovinaBotswanaBrazilBrunei DarussalamBulgariaBurkina FasoBurundiCabo VerdeCambodiaCameroonCanadaCaribbean small statesCentral African RepublicCentral Europe and the BalticsChadChileChinaColombiaComorosCongo, Dem. Rep.Congo, Rep.Costa RicaCote d'IvoireCroatiaCubaCyprusCzech RepublicDenmarkDjiboutiDominicaDominican RepublicEarly-demographic dividendEast Asia & PacificEast Asia & Pacific (excluding high income)East Asia & Pacific (IDA & IBRD countries)EcuadorEgypt, Arab Rep.El SalvadorEquatorial GuineaEritreaEstoniaEthiopiaEuro areaEurope & Central AsiaEurope & Central Asia (excluding high income)Europe & Central Asia (IDA & IBRD countries)European UnionFijiFinlandFragile and conflict affected situationsFranceGabonGambia, TheGeorgiaGermanyGhanaGreeceGreenlandGrenadaGuatemalaGuineaGuinea-BissauGuyanaHaitiHeavily indebted poor countries (HIPC)High incomeHondurasHong Kong SAR, ChinaHungaryIBRD onlyIcelandIDA & IBRD totalIDA blendIDA onlyIDA totalIndiaIndonesiaIran, Islamic Rep.IraqIrelandIsraelItalyJamaicaJapanJordanKazakhstanKenyaKiribatiKorea, Rep.KosovoKuwaitKyrgyz RepublicLao PDRLate-demographic dividendLatin America & Caribbean Latin America & Caribbean (excluding high income)Latin America & the Caribbean (IDA & IBRD countries)LatviaLeast developed countries: UN classificationLebanonLesothoLiberiaLibyaLiechtensteinLithuaniaLow & middle incomeLow incomeLower middle incomeLuxembourgMacao SAR, ChinaMacedonia, FYRMadagascarMalawiMalaysiaMaldivesMaliMaltaMarshall IslandsMauritaniaMauritiusMexicoMicronesia, Fed. Sts.Middle East & North AfricaMiddle East & North Africa (excluding high income)Middle East & North Africa (IDA & IBRD countries)Middle incomeMoldovaMonacoMongoliaMontenegroMoroccoMozambiqueMyanmarNamibiaNepalNetherlandsNew ZealandNicaraguaNigerNigeriaNorth AmericaNorwayOECD membersOmanOther small statesPacific island small statesPakistanPalauPanamaPapua New GuineaParaguayPeruPhilippinesPolandPortugalPost-demographic dividendPre-demographic dividendPuerto RicoQatarRomaniaRussian FederationRwandaSamoaSan MarinoSao Tome and PrincipeSaudi ArabiaSenegalSerbiaSeychellesSierra LeoneSingaporeSlovak RepublicSloveniaSmall statesSolomon IslandsSouth AfricaSouth AsiaSouth Asia (IDA & IBRD)SpainSri LankaSt. Kitts and NevisSt. LuciaSt. Vincent and the GrenadinesSub-Saharan Africa Sub-Saharan Africa (excluding high income)Sub-Saharan Africa (IDA & IBRD countries)SudanSurinameSwazilandSwedenSwitzerlandSyrian Arab RepublicTajikistanTanzaniaThailandTimor-LesteTogoTongaTrinidad and TobagoTunisiaTurkeyTurkmenistanTuvaluUgandaUkraineUnited Arab EmiratesUnited KingdomUnited StatesUpper middle incomeUruguayUzbekistanVanuatuVenezuela, RBVietnamWest Bank and GazaWorldYemen, Rep.ZambiaZimbabwe Timeline:
This timeline shows a graph from 1971 to 2015 of Ireland. No data until 1970. Number of actual observations by date: 45.
Source name:
World Development Indicators
Source organization:
World Bank staff estimates using data from the United Nations Statistics Division's National Accounts Statistics.
Categories, topics:
Economy & Growth, Environment
Last updated:
apr 23, 2017
Indicators value changes by year
Maximum:
18.845
jan 1, 2013
At the date of observation
Value
Absolute change
Change from previous value
jan 1, 1971
8.718
+8.718
0.0%
jan 1, 1972
8.808
+0.09
1.03%
jan 1, 1973
8.675
-0.133
-1.51%
jan 1, 1974
8.445
-0.23
-2.65%
jan 1, 1975
9.163
+0.718
8.5%
jan 1, 1976
8.503
-0.66
-7.2%
jan 1, 1977
9.087
+0.583
6.86%
jan 1, 1978
9.528
+0.442
4.86%
jan 1, 1979
10.721
+1.193
12.52%
jan 1, 1980
11.145
+0.424
3.95%
jan 1, 1981
12.239
+1.094
9.81%
jan 1, 1982
11.42
-0.819
-6.69%
jan 1, 1983
11.688
+0.268
2.34%
jan 1, 1984
11.976
+0.289
2.47%
jan 1, 1985
11.52
-0.457
-3.81%
jan 1, 1986
11.606
+0.087
0.75%
jan 1, 1987
11.557
-0.049
-0.43%
jan 1, 1988
11.793
+0.237
2.05%
jan 1, 1989
11.403
-0.391
-3.31%
jan 1, 1990
11.514
+0.111
0.97%
jan 1, 1991
11.601
+0.087
0.76%
jan 1, 1992
12.131
+0.53
4.57%
jan 1, 1993
12.19
+0.059
0.48%
jan 1, 1994
12.134
-0.056
-0.46%
jan 1, 1995
12.51
+0.376
3.1%
jan 1, 1996
12.551
+0.041
0.33%
jan 1, 1997
12.384
-0.167
-1.33%
jan 1, 1998
12.169
-0.214
-1.73%
jan 1, 1999
12.205
+0.036
0.29%
jan 1, 2000
12.992
+0.787
6.45%
jan 1, 2001
13.19
+0.199
1.53%
jan 1, 2002
13.574
+0.384
2.91%
jan 1, 2003
13.897
+0.323
2.38%
jan 1, 2004
14.207
+0.31
2.23%
jan 1, 2005
14.847
+0.64
4.5%
jan 1, 2006
15.969
+1.122
7.56%
jan 1, 2007
17.035
+1.066
6.68%
jan 1, 2008
16.543
-0.492
-2.89%
jan 1, 2009
16.385
-0.158
-0.96%
jan 1, 2010
17.608
+1.223
7.46%
jan 1, 2011
17.932
+0.324
1.84%
jan 1, 2012
17.856
-0.076
-0.42%
jan 1, 2013
18.845
+0.989
5.54%
jan 1, 2014
18.534
-0.311
-1.65%
jan 1, 2015
17.891
-0.644
-3.47%
Ranking of countries by current statistics by years


Comments: